Final report
Prepared for Transport Canada
Supplier: Phoenix SPI
Contract Number: CW2379934
Contract Value: $110,672.20 (including HST)
Award Date: 2024-11-04
Delivery Date: 2025-03-17
Registration Number: POR 068-24
For more information on this report, please contact Transport Canada at TC.Publicopinion-Opinionpublique.TC@tc.gc.ca.
Ce rapport est aussi disponible en français.
Canadians’ Awareness and Confidence in Canada’s Transportation System
Final Report
This public opinion research report presents the findings of a 15-minute online survey conducted with 1,587 Canadians aged 18 and older, along with five virtual focus groups—four with the general public and one with Indigenous Peoples. The survey was conducted from January 8 to 26, 2025, while the focus groups took place from February 18 to 20, 2025.
Cette publication est aussi disponible en français sous le titre Recherche sur l'opinion publique: Connaissance et confiance des Canadiens à l’égard du système de transport du Canada
Transport Canada grants permission to copy and/or reproduce the contents of this publication for personal and public non-commercial use. Users must reproduce the materials accurately, identify Transport Canada as the source and not present theirs as an official version, or as having been produced with the help or the endorsement of Transport Canada.
To request permission to reproduce materials from this publication for commercial purposes, please complete the following web form: www.tc.gc.ca/eng/crown-copyright-request-614.html
Or contact TCcopyright-droitdauteurTC@tc.gc.ca
Catalogue Number:
International Standard Book Number (ISBN):
© His Majesty the King in Right of Canada, as represented by the Minister of Transport, 2025.
List of Figures
Phoenix Strategic Perspectives (Phoenix SPI) was commissioned by Transport Canada to conduct quantitative and qualitative public opinion research (POR) to measure Canadians’ and Indigenous Peoples’ attitudes and perceptions of transportation.
The purpose of the research was to help Transport Canada understand the interests and behaviours of the population as they relate to the department’s mandate. The specific objectives of this POR study were to measure attitudes and perceptions of transportation with a focus on the following areas: communication preferences; awareness and perceptions of Transport Canada’s programs, services and activities; and confidence in the safety, security, and efficiency of Canada’s transportation system.
The research included a 15-minute probability online survey of 1,587 Canadians aged 18+ and five 90-minute virtual focus groups. The online survey included an oversample of Indigenous Peoples. The results were weighted to reflect the actual distribution of the population based on region, age, and gender. The margin of error for a sample of this size, accounting for the design effect of the oversample, is ±2.9 percentage points, 19 times out of 20. Four focus groups were conducted with Canadians aged 18+ and one with Indigenous Peoples. The groups with Canadians were segmented by region of the country, with one group conducted in the West, one in Ontario, one in Quebec (French), and one in Atlantic Canada. The fieldwork took place from January 8 to 16, 2025 (online survey) and from February 18 to 20, 2025 (virtual focus groups).
The survey results are generalizable to the target population because probability sampling was used. The focus group results, however, cannot be quantified or generalized to the full population of Canadians and Indigenous Peoples. The findings from the research will be used by Transport Canada to more effectively communicate and engage with Canadians.
The contract value was $110,672.20 (including HST).
I hereby certify as a Senior Officer of Phoenix SPI that the deliverables fully comply with the Government of Canada political neutrality requirements outlined in the Policy on Communications and Federal Identity of the Government of Canada and Directive on the Management of Communications. Specifically, the deliverables do not contain any reference to electoral voting intentions, political party preferences, standings with the electorate, or ratings of the performance of a political party or its leader.
(original signed by)
Alethea Woods
President
Phoenix Strategic Perspectives Inc.
Transport Canada serves the public interest through the promotion of a safe, secure, efficient, and environmentally responsible transportation system in Canada. The department plays a key leadership role in ensuring all parts of the transportation system across the country work together effectively. In this role, Transport Canada is responsible for implementing programs and updating policies, laws, regulations, and standards designed to support innovation, sustainability and the future of transportation.
Given Transport Canada’s role, it is essential for the department to understand the transportation-related needs and opinions of Canadians and how they access and consume information. As part of the Transportation 2030: Strategic Plan, the department aims to increase trust in Canada’s transportation system, which can only be achieved through effective communication and engagement with Canadians. Transport Canada’s Communications Branch intends to build this trust and confidence by creating a heightened awareness of Transport Canada’s programs, services, initiatives and activities.
To support the department’s communications efforts, Transport Canada commissioned public opinion research (POR). The purpose of the research was to help the department understand the interests and behaviours of the population as they relate to Transport Canada’s mandate. The results of the POR study will serve as a baseline to measure and track the department’s communications efforts to enhance public trust.
The specific objectives of this POR study were to measure attitudes and perceptions of transportation with a focus on the following areas: communication preferences—specifically, the channels, as well as style and tone of messages that resonate with the population; awareness and perceptions of Transport Canada’s programs, services and activities; and the population’s confidence in the safety, security and efficiency of Canada’s transportation system.
The findings from the research will be used by Transport Canada to more effectively communicate and engage with Canadians. Additionally, the department intends to leverage the results to support its strategic priorities and achieve the intended results.
This POR included both quantitative and qualitative components:
For a more complete description of the methodology, refer to the Appendix: Technical Specifications.
This section of the report focuses on the types of transportation typically used by survey respondents. Similar questions were not asked of focus group participants.
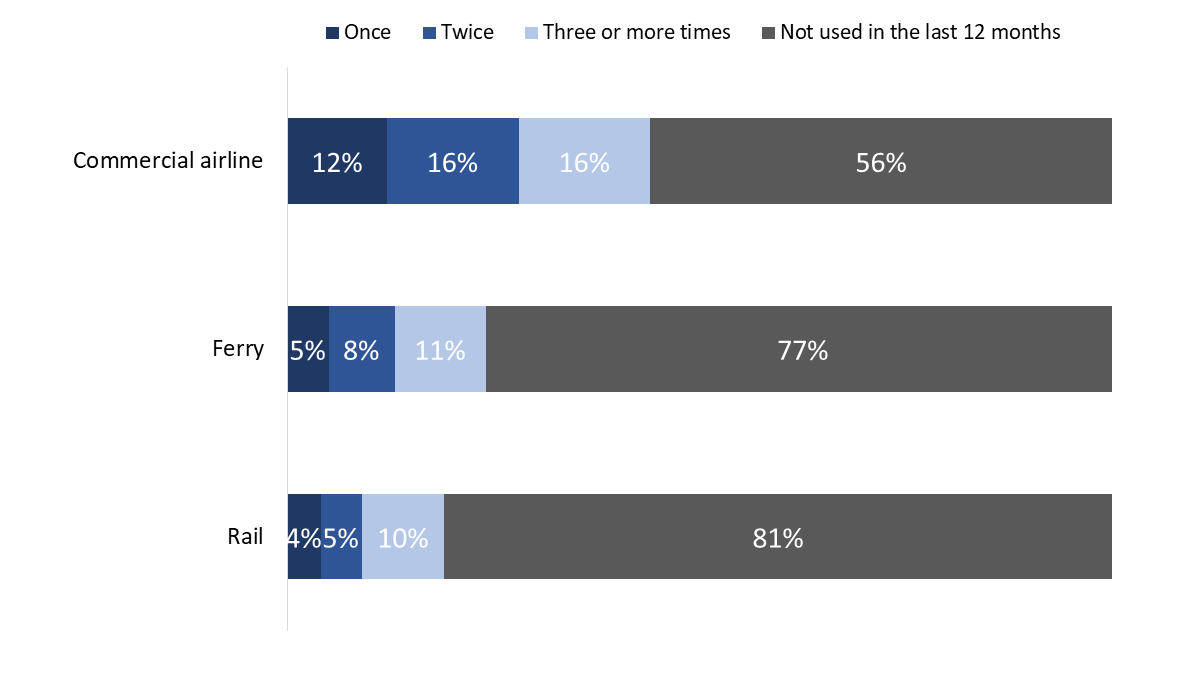
More Canadians have travelled by air than ferry or rail in the last 12 months
Just over four in 10 (44%) surveyed Canadians have travelled at least once by commercial airline in the last 12 months—specifically, 12% have travelled once, 16% twice, and 16% three or more times. Fewer have travelled at least once by ferry (24%) or rail (19%). The vast majority have not used a ferry (77%) or train (81%) in the last 12 months.
| Not used in the last 12 months | Once | Twice | Three or more times | |
| Commercial airline | 56% | 12% | 16% | 16% |
| Ferry | 77% | 5% | 8% | 11% |
| Rail | 81% | 4% | 5% | 10% |
Q6. In the last 12 months, how many times did you use the following methods of transportation? Base: n=1,587; all respondents, excluding “don’t know”.
18- to 34-year-olds were the most likely to have travelled by air (50%) and rail (29%) in the last 12 months, and they were more likely than those aged 55+ to have travelled by ferry (27%). Residents of Atlantic Canada and the western provinces were more likely to have travelled by air (54% and 52%, respectively) and ferry (37% and 38%, respectively) in the last year, while residents of Ontario (27%) followed by Quebec (19%) were more likely to have travelled by rail. Those from households reporting an annual income of $150,000 or more (59%) were the most likely to have travelled by air in the last year, while those with a high school education or less (57%) were the most likely to have not used any of these modes of transportation in the last 12 months.
Many Canadians live within 25 kms of an airport, rail station or rail crossing
The majority of surveyed Canadians reside within 25 km of an airport (65%), a rail station (57%), and a rail crossing (54%). Additionally, 25% live within this distance of a port, while 11% are near a border crossing. Meanwhile, 12% of respondents reported not living within 25 km of any of these transportation infrastructures.
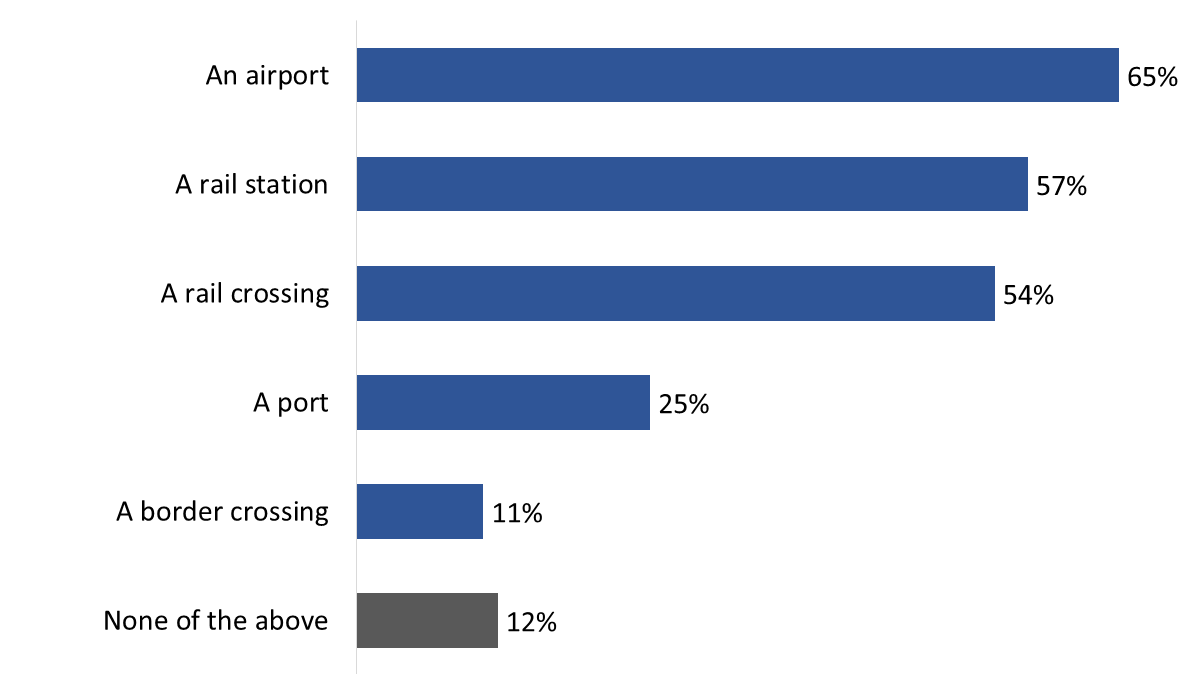
| An airport | 65% |
| A rail station | 57% |
| A rail crossing | 54% |
| A port | 25% |
| A border crossing | 11% |
| None of the above | 12% |
Q8. Do you live within 25 kms of any of the following? Base: n=1,587; all respondents, excluding “don’t know”.
For most Canadians, a car is their main mode of daily transportation
Nearly three-quarters (73%) of respondents said that driving a car is their main way of getting around on a typical day. As shown in Figure 3, fewer than one in 10 surveyed Canadians rely on other methods of transportation.
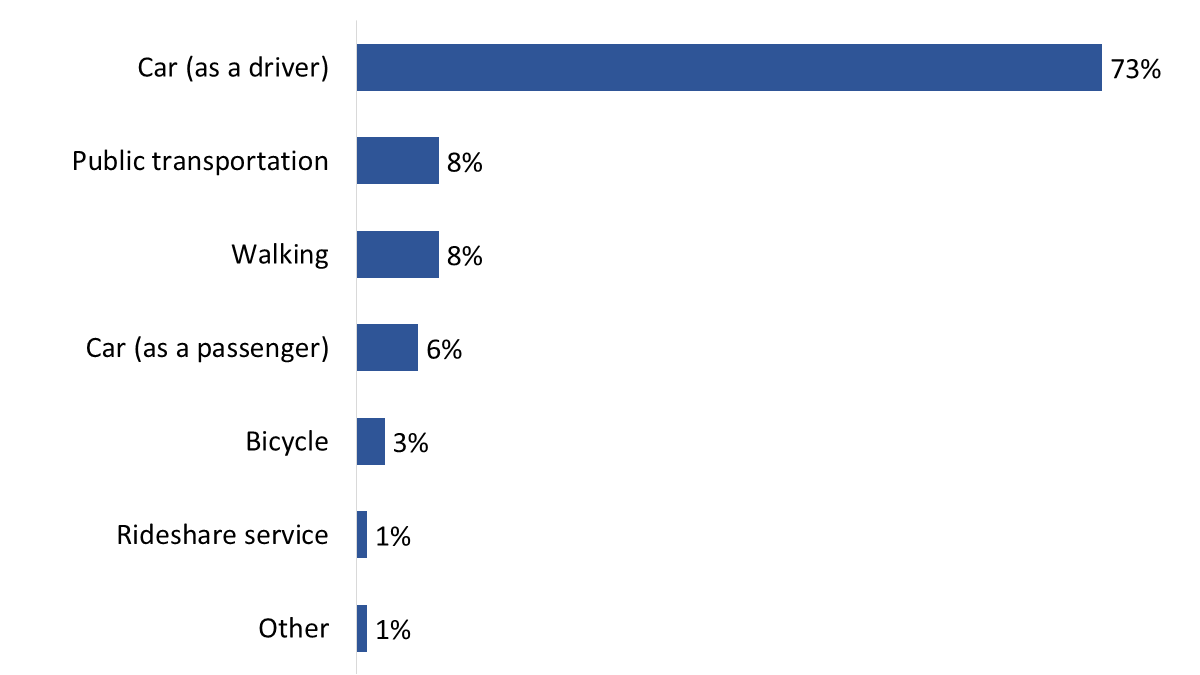
| Car (as a driver) | 73% |
| Public transportation | 8% |
| Walking | 8% |
| Car (as a passenger) | 6% |
| Bicycle | 3% |
| Rideshare service | 1% |
| Other | 1% |
Q9. What is your main way of getting around on a typical day? Base: n=1,587; all respondents, excluding “don’t know”.
The likelihood of being a driver increases with age, from 64% among 18–34-year-olds to 77% among those aged 55 and older. Individuals from households earning less than $40,000 per year are the least likely to drive (50%) and more likely to walk (14%) or use public transportation (19%). Regionally, residents of the Prairies (83%) are the most likely to drive a car to get around on a typical day.
The vast majority of drivers operate a gas-powered vehicle
When drivers (n=1,169) were asked what type of energy source powers their vehicle, more than eight in 10 (84%) said gas. Very few use alternative energy sources: hybrid (7%), electricity (6%), and diesel (3%).

| Gas | 84% |
| Hybrid | 7% |
| Electricity | 6% |
| Diesel | 3% |
Q10. What type of energy source powers your vehicle? Base: n=1,169; drivers.
Drivers in Quebec (78%) are less likely to drive a gas-powered vehicle than those in Ontario (86%) or the West (85%). Lower-income individuals are more likely to use gas-powered vehicles, with 99% of those earning $40,000–$59,999 and 95% of those earning under $40,000 relying on gas.
Drivers are split between gas and alternative fuels when it comes to their next vehicle
One-third of drivers think their next vehicle will be either hybrid (23%) or zero-emissions (12%), while almost the same proportion believe it will be a gas-powered vehicle (34%). Thiry percent of surveyed drivers did not know the power source of their next vehicle.
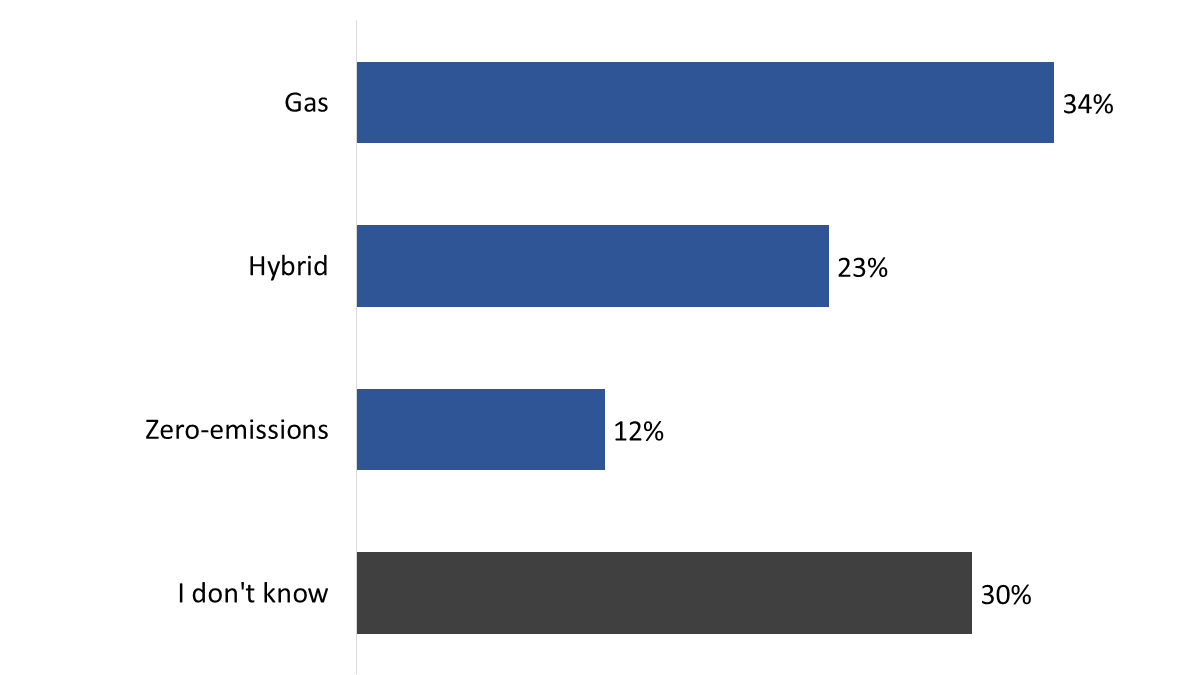
| Gas | 34% |
| Hybrid | 23% |
| Zero-emissions | 12% |
| I don't know | 30% |
Q11. Is your next new vehicle going to be: Base: n=1,169; drivers.
Indigenous drivers (64%) were more likely to say their next vehicle will be gas-powdered, while those in Quebec (26%) were most likely to point to a zero-emissions car.
Most surveyed Canadians do not participate in recreational boating
Seventy-two percent of respondents reported that they do not participate in recreational boating. Meanwhile, 19% ride as passengers at least once a year, 9% own a boat and use it annually, and 2% rent a boat at least once a year.
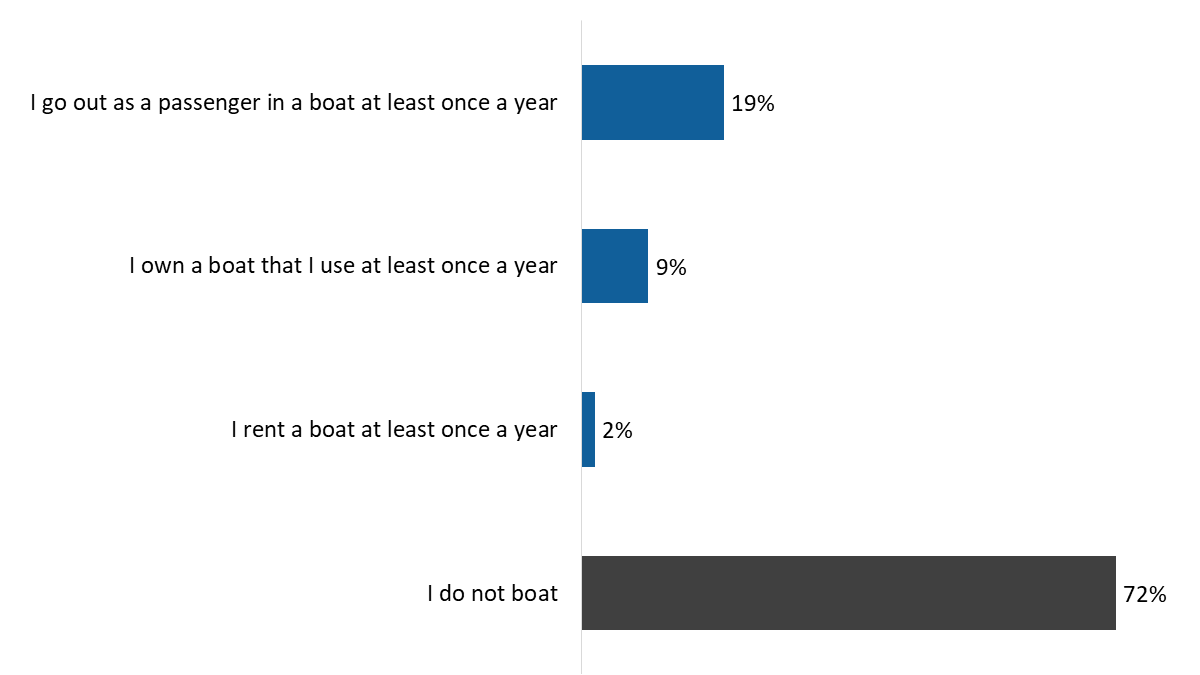
| I go out as a passenger in a boat at least once a year | 19% |
| I own a boat that I use at least once a year | 9% |
| I rent a boat at least once a year | 2% |
| I do not boat | 72% |
Q12. Which, if any, of the following apply to you? [Multiple responses accepted] Base: n=1,587; all respondents, excluding “don’t know”.
The likelihood of riding as a passenger in a recreational boat and owning a boat generally increases with age. Additionally, Indigenous Peoples (28%) are more likely than other Canadians (18%) to be passengers in a recreational boat at least once a year.
Boat use varies, but the majority of boaters own or rent motorized boats
Slightly more than half (57%) of recreational boaters own or rent a yacht, powerboat, motorboat, or speedboat. About three in 10 own or rent kayaks (30%) and canoes (29%), while two in 10 (20%) own or rent paddleboards. Eighteen percent own or rent pontoons. The complete list of boats used is shown in Figure 7.
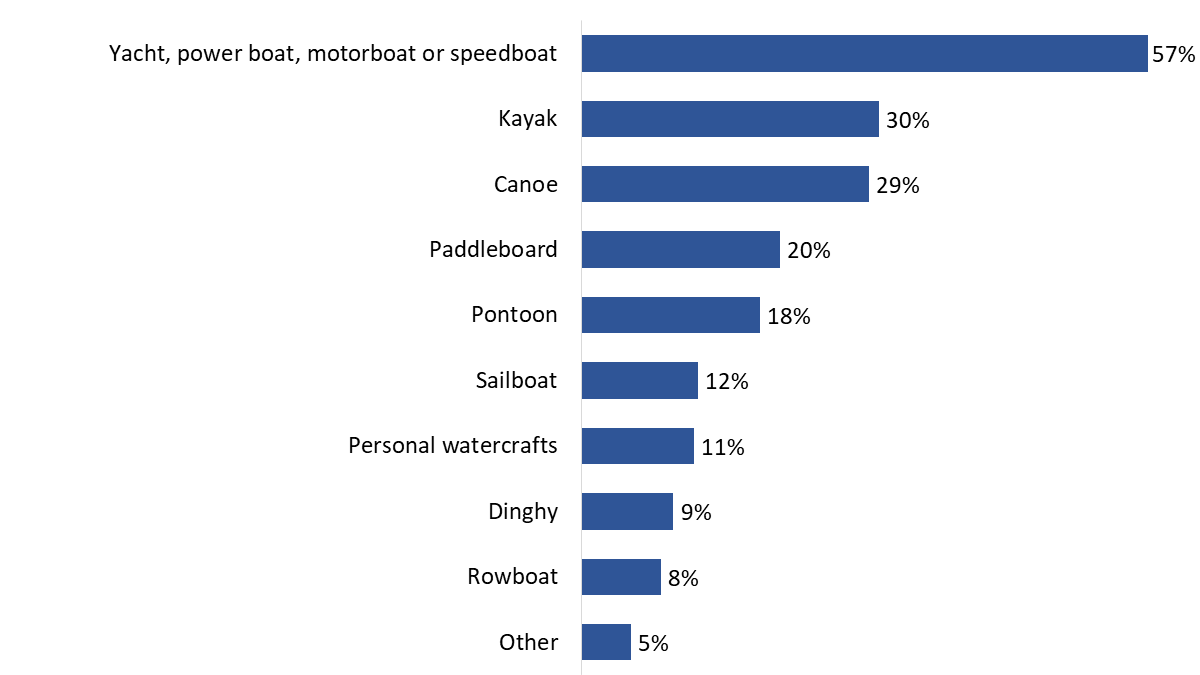
| Yacht, power boat, motorboat or speedboat | 57% |
| Kayak | 30% |
| Canoe | 29% |
| Paddleboard | 20% |
| Pontoon | 18% |
| Sailboat | 12% |
| Personal watercrafts | 11% |
| Dinghy | 9% |
| Rowboat | 8% |
| Other | 5% |
Q14. What type of boat do you own or rent? [Multiple responses accepted] Base: n=191; boater owners or renters.
This section of the report focuses on the general perceptions and knowledge of transportation in Canada. The survey findings are presented first, followed by the focus group findings.
Before responding to the next questions, survey respondents were informed that a transportation system refers to roads, bridges, railways, airports, and ports that support the movement of people and goods within Canada.
Many said that government is most responsible for a safe and secure transportation system
Respondents were asked who they believe is most responsible for a safe and secure transportation system in Canada. Just over half said government, with 35% selecting the Government of Canada and 19% choosing provincial and territorial governments. Few feel Canadians (5%) or industry and businesses (3%) are responsible, while the largest group (38%) believes all four actors share responsibility.
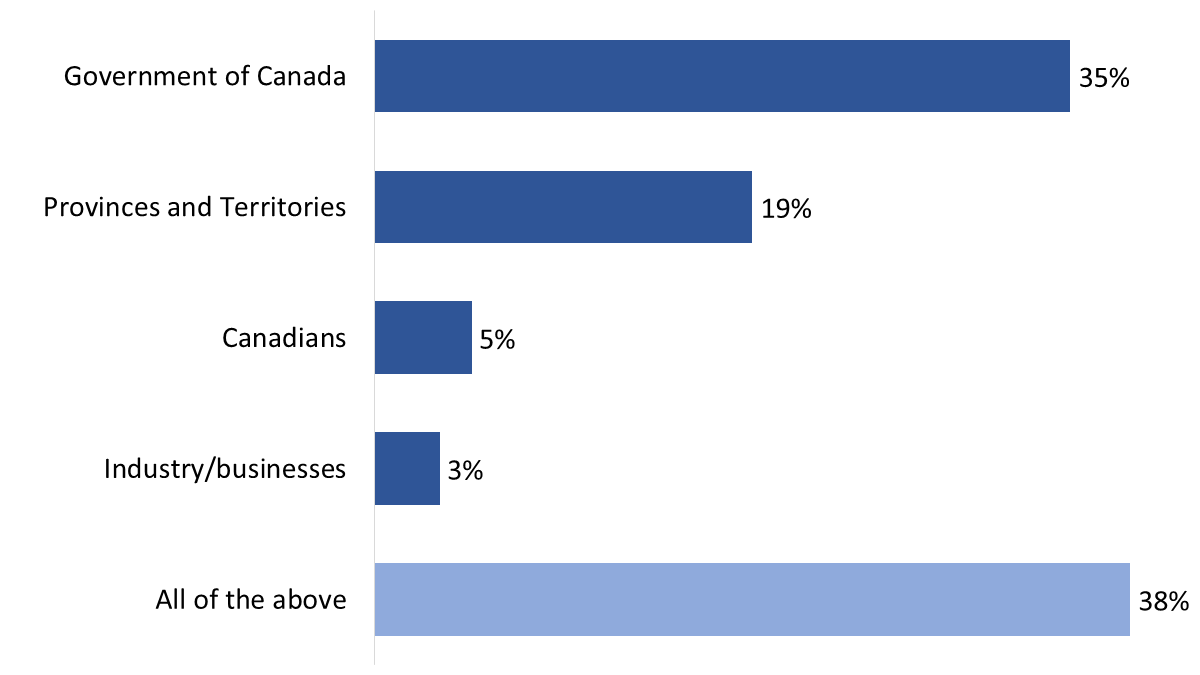
| Government of Canada | 35% |
| Provinces and Territories | 19% |
| Canadians | 5% |
| Industry/businesses | 3% |
| All of the above | 38% |
Q15. Who is most responsible for a safe and secure transportation system in Canada? Base: n=1,587; all respondents, excluding “don’t know”.
Younger Canadians (38% of 18- to 34-year-olds) were more likely to point to the Government of Canada, while older Canadians were more likely to say that responsibility is shared among all actors (40% of those aged 35–54 and 41% of those 55+). Indigenous Peoples (27%) and Quebec residents (28% compared to 45% of Atlantic Canadians and 38% of Ontarians) were less likely to hold the Government of Canada responsible.
Canadians hold moderately positive perceptions of Transport Canada
When asked for their overall impression of Transport Canada, 22% of respondents indicated they did not know enough about the department to form an opinion. Those who expressed an opinion were more likely to hold a positive view, with 42% reporting a somewhat positive impression and 11% a very positive one. One-quarter of respondents offered a negative impression (19% somewhat negative and 6% very negative). When those who were unable to provide an opinion are excluded, the proportion of Canadians with positive impressions increases to 68% (14% very positive and 54% somewhat positive).
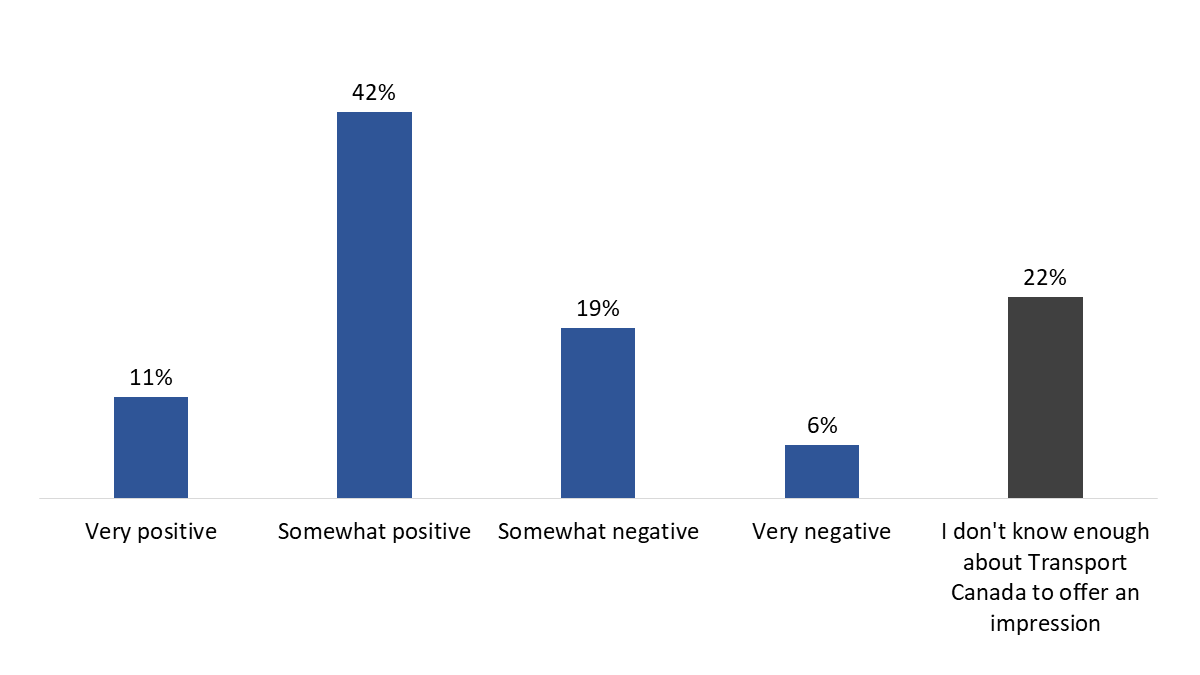
| Very positive | 11% |
| Somewhat positive | 42% |
| Somewhat negative | 19% |
| Very negative | 6% |
| I don't know enough about Transport Canada to offer an impression | 22% |
Q16. What's your overall impression of Transport Canada? Base: n=1,587; all respondents.
The likelihood of having a positive impression of Transport Canada increases with age, from 57% of 18- to 34-year-olds to 75% of those 55 and older. Regionally, residents of Atlantic Canada (78%) and Quebec (73%) were more likely to hold a positive impression than those in Ontario (64%) and the West (68%).
Top-of-mind impressions about Canada’s transportation system tend to be critical
When asked to try to express in one word what comes to mind when they think about Canada’s transportation system, focus group participants tended to use critical terms. This included ‘ineffective’, ‘inefficient’, ‘inconsistent’, ‘inaccessible’, ‘inadequate’, ‘underfunded’, ‘poor’, ‘challenged’, ‘complicated’, ‘chaotic’, ‘expensive’, ‘old’, ‘poorly managed’, ‘lacking’, ‘deficient’, and ‘in need of improvement’. Other terms that came to mind included ‘vast’, ‘manageable’, ‘OK’, ‘effective’, ‘evolving’, ‘improving’, ‘very good’, and ‘trains’.
Modes of transportation and infrastructure are seen as key elements of a transportation system
When asked about the components of a transportation system, participants most commonly mentioned different modes of transportation, such as planes, trains, automobiles, ferries, ships, and buses. Many also identified key elements of transportation infrastructure, including roadways, rail lines, waterways, air routes, tunnels, bridges, ports, airports, and charging stations for electric vehicles.
In addition to modes of transportation and infrastructure, a few participants emphasized the public dimension of transportation, such as government funding, maintenance, and the availability of public or shared transportation options. Finally, a few also focused on the logistical and organizational aspects, referencing customs services, the efficient movement of people and goods, connectivity between population centers, and the coordination of transportation supply with demand.
Responsibility for a safe and secure transportation system is seen as shared
Participants routinely characterized transportation safety and security as a shared or joint responsibility between different levels of government in Canada. That said, many felt that the federal and provincial governments play the biggest roles and therefore have primary responsibility. Some described the federal responsibility as relating to aspects of transportation that involve the country as a whole or that are inter-provincial, as well as key infrastructure like ports, airports, and rail lines.
Beyond government, participants suggested that individuals also have a responsibility for maintaining a safe and secure transportation system. This included the responsibility of individual operators of public and private modes of transportation, as well as the general responsibility everyone has to respect laws and regulations related to transportation in Canada.
Transport Canada seen as having oversight of transportation system
Most participants said that they had heard of Transport Canada, but only a few recalled seeing or hearing anything about the department recently in the news. This included the plan for a high-speed rail system between Quebec City and Toronto, and regulations related to drone usage. Asked specifically what they know about Transport Canada and its responsibilities when it comes to transportation in Canada, participants routinely pointed to general oversight of Canada’s transportation system, with a focus on the following:
A few participants said they were unsure about Transport Canada’s specific responsibilities when it comes to transportation in Canada.
Improving transportation services seen as the most important transportation issues facing Canada
A recurring theme in the discussion about important transportation issues in Canada was the need to improve transportation services for Canadian travellers, with a focus on the following:
Additional transportation issues or challenges identified by participants included the following:
Reasons provided to explain the importance of several of these types of issues included the following:
Limited awareness of what is being done to address transportation issues
Most participants said they are not aware of what, if anything, the Government of Canada is doing to address the transportation issues and challenges they identified as important. Some added that, although they are not sure how, they assume these issues are being addressed. Measures or actions that were identified included the recent announcement of a plan for a high-speed rail system between Quebec City and Toronto, government intervention to end strikes affecting Canada’s ports and rail system, and the incentivising of green transportation.
These next questions are about safety and security in Canada’s transportation system. The survey findings are presented first, followed by the focus group findings.
Most Canadians are confident in the safety of Canada’s transportation system
Eighty-five percent of surveyed Canadians expressed confidence in the overall safety of Canada’s transportation system, with 53% reporting they are somewhat confident and 32% very confident. The remaining 14% are not very confident (11%) or not confident at all (3%).
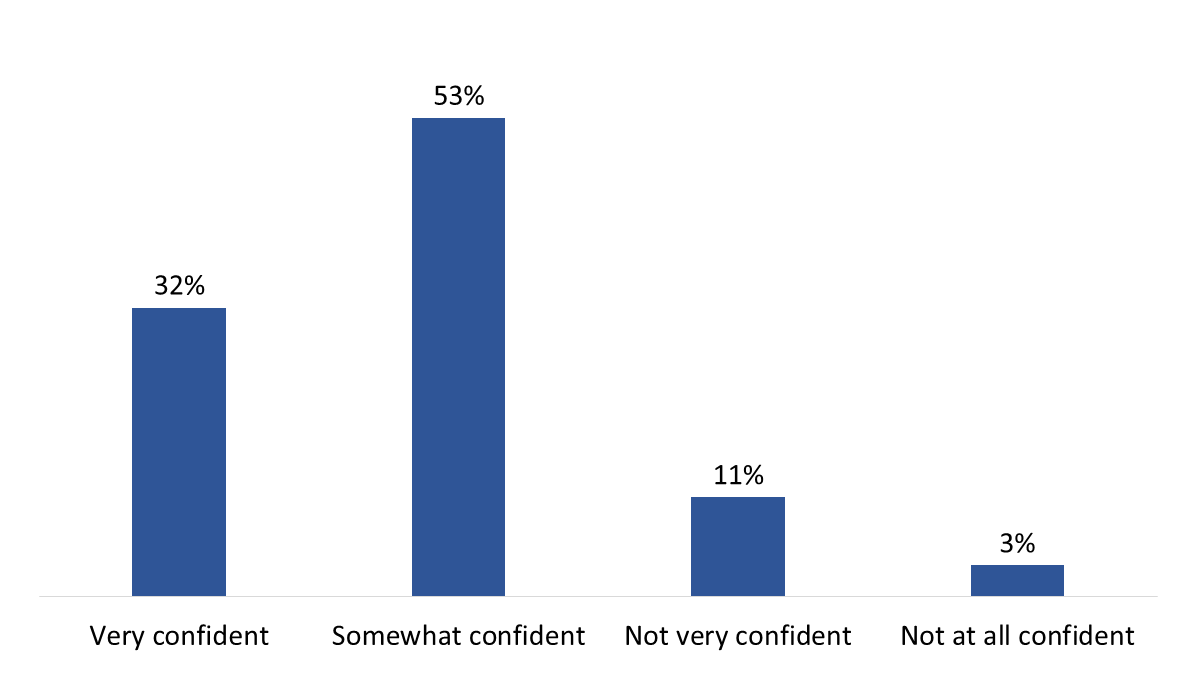
| Very confident | 32% |
| Somewhat confident | 53% |
| Not very confident | 11% |
| Not at all confident | 3% |
Q17. How confident are you in the overall safety of Canada's transportation system? Base: n=1,587; all respondents, excluding “don’t know”.
Confidence in the safety of Canada’s transportation system is higher among women (88%) and residents of Atlantic Canada (95%).
Vast majority thinks it is safe to travel within Canada
Ninety-five percent of respondents think it is very safe (41%) or generally safe (54%) to travel within Canada, whether by road, rail, air or water. Five percent said it is generally unsafe (4%) or very unsafe (1%).
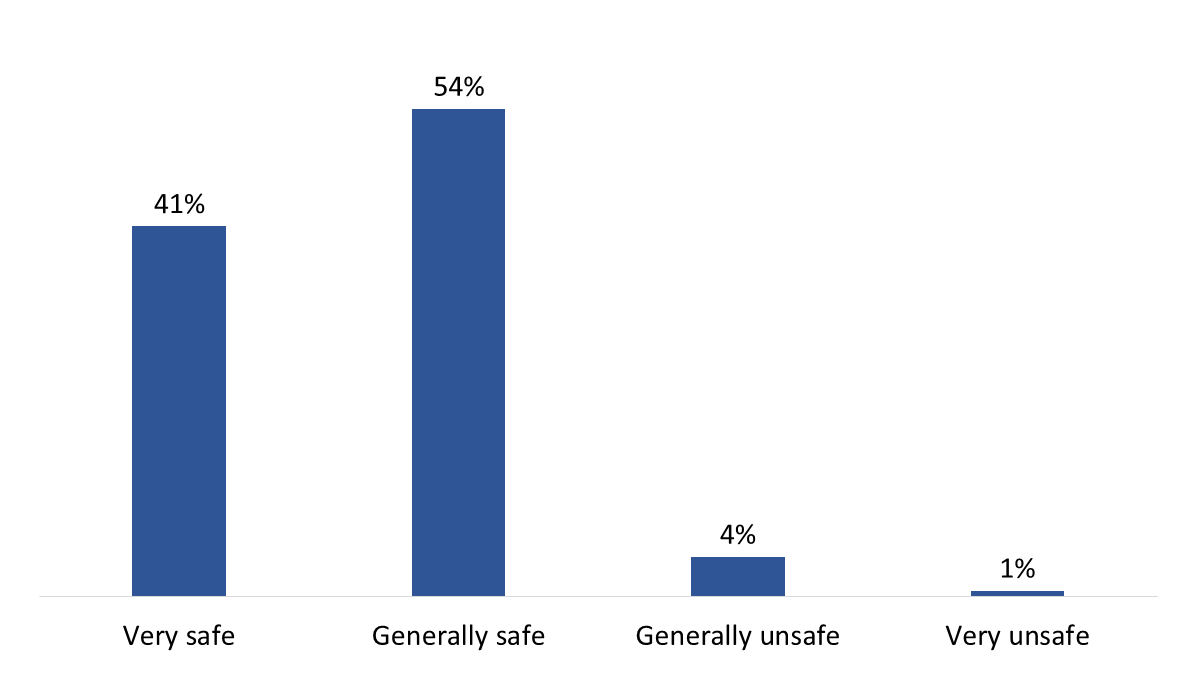
| Very safe | 41% |
| Generally safe | 54% |
| Generally unsafe | 4% |
| Very unsafe | 1% |
Q18. Overall, how safe do you think it is to travel within Canada, whether by road, rail, air or water? Base: n=1,587; all respondents, excluding “don’t know”.
The likelihood of thinking it is safe to travel within Canada increases with age, from 95% of 18- to 34-year-olds to 98% of those 65 and older. Regionally, residents of Atlantic Canada (100%) followed by Quebec (97%) were the most likely to consider travel safe.
Air and rail viewed as ‘very safe’ by more Canadians than water and road
When asked to rate the overall safety of four modes of transportation, more than four in 10 respondents rated air (48%) and rail (45%) as very safe. Most of the remaining respondents considered these modes to be somewhat safe, resulting in 98% rating air and 96% rating rail as generally or very safe. In comparison, 32% considered travel by water to be very safe, while 64% rated it as somewhat safe. For travel by road, just 8% considered it very safe, 73% somewhat safe, and 19% unsafe.
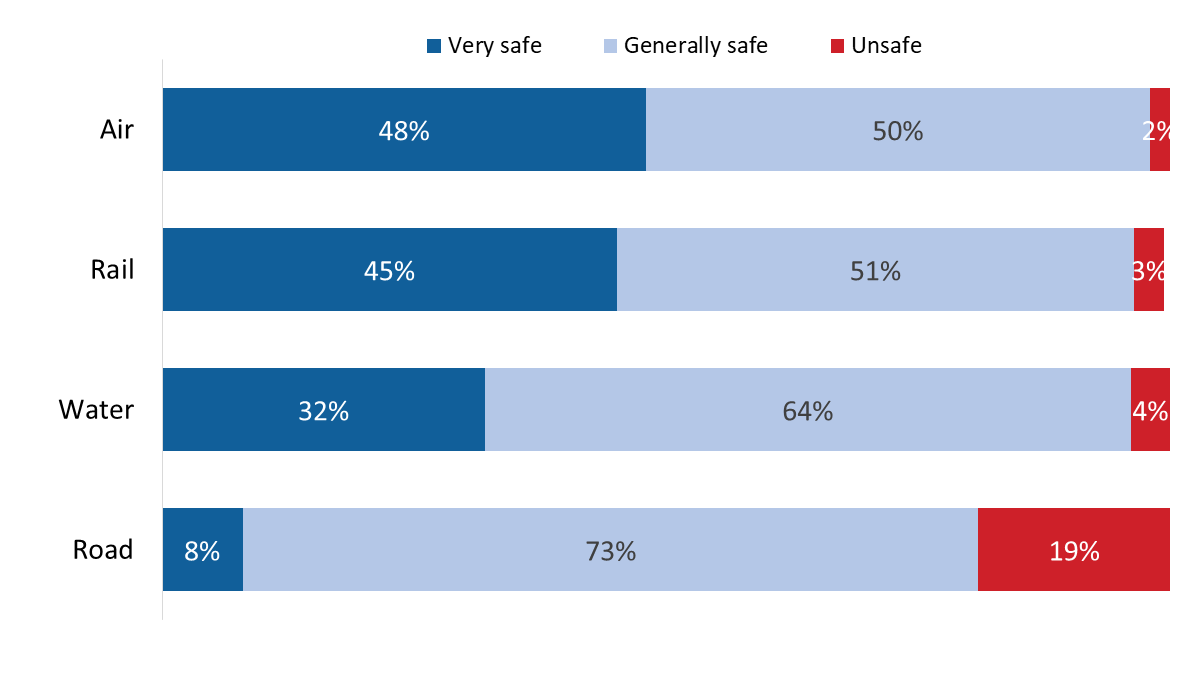
| Very safe | Generally safe | Unsafe | |
| Air | 48% | 50% | 2% |
| Rail | 45% | 51% | 3% |
| Water | 32% | 64% | 4% |
| Road | 8% | 73% | 19% |
Q19. How would you rate the overall safety of each of the following? Base: n=1,587; all respondents, excluding “don’t know”.
Canadians aged 55 and older were the most likely to say that driving is safe. Residents of Atlantic Canada and Quebec were more likely to view both road travel (88% and 87%, respectively) and air travel (100% each) as safe.
Majorities believe Transport Canada is doing a good job with air, rail, water and road safety
Three-quarters (74%) of respondents said that Transport Canada is doing a good (38%) or very good (36%) job with air safety. Similar proportions rated Transport Canada’s performance in relation to rail safety (60%) and water safety (57%) as good or very good, while about half (52%) said the department is doing a good or very good job when it comes to road safety. Very few assessed Transport Canada’s performance as poor. Between 13% and 30% were uncertain how to rate the government department.

| Very good | Good | Fair | Poor/very poor | Don't know | |
| Air safety | 36% | 38% | 9% | 2% | 15% |
| Rail safety | 24% | 36% | 11% | 4% | 25% |
| Water safety | 20% | 37% | 11% | 2% | 30% |
| Road safety | 10% | 42% | 24% | 11% | 13% |
Q20. Please rate Transport Canada's performance in the following areas. Base: n=1,587; all respondents.
Ontarians (70%) were more likely than Quebec residents (58%) and western Canadians (50%) to say that Transport Canada is doing a good job on rail safety. Additionally, older Canadians (aged 55+) were more likely to give Transport Canada positive ratings for rail (70%), water (63%), air (82%), and road (63%) safety.
Canadians see a variety of threats to road safety with distracted driving topping the list
Forty percent of respondents identified distracted driving as the biggest threat to road safety in Canada. Other threats were mentioned by smaller percentages: poor road conditions (17%), speeding (15%), driving under the influence (11%), and new technologies (3%). Additionally, 14% of respondents volunteered other threats.
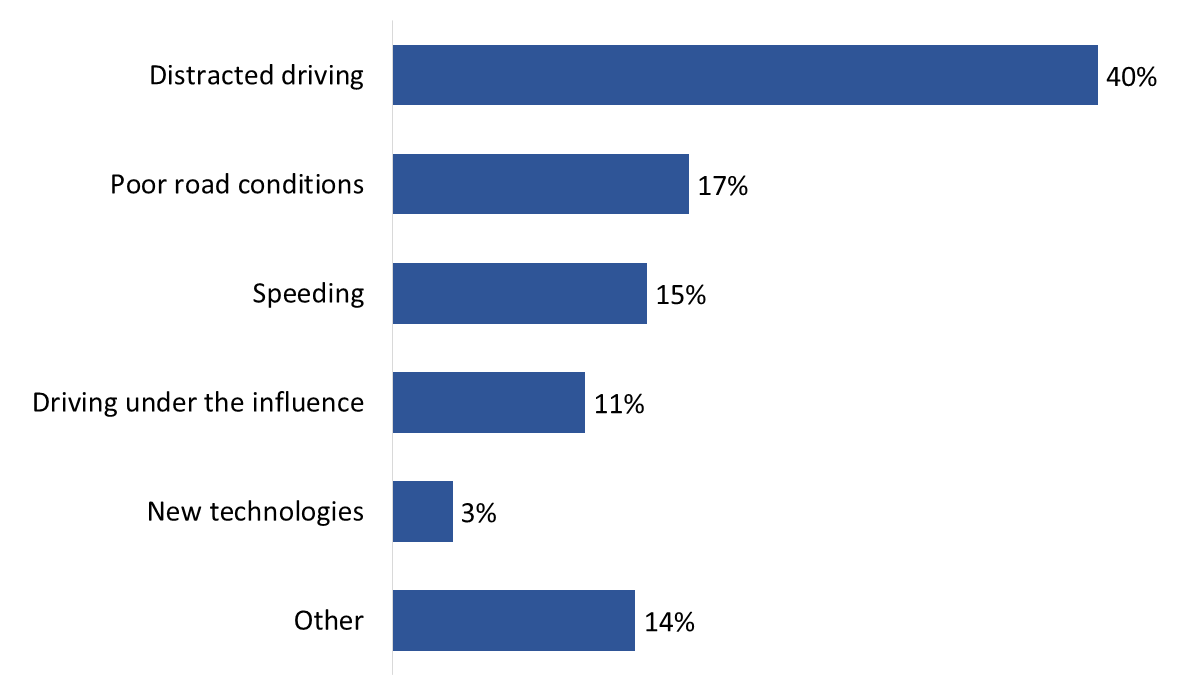
| Distracted driving | 40% |
| Poor road conditions | 17% |
| Speeding | 15% |
| Driving under the influence | 11% |
| New technologies | 3% |
| Other | 14% |
Q21. What do you believe is the biggest threat to road safety in Canada? Base: n=1,587; all respondents.
Men (20%) were more likely to view poor road conditions as the biggest threat to road safety, while women (19%) were more likely to see speeding as the greatest risk.
Two-thirds think transporting hazardous materials within Canada is generally safe
Sixty-four percent of surveyed Canadians think it is generally safe to transport hazardous materials within Canada, with an additional 13% considering it very safe. In total, 77% of respondents view the transport of hazardous materials as safe. On the other hand, 11% consider it generally unsafe, 4% very unsafe, and 9% were uncertain.
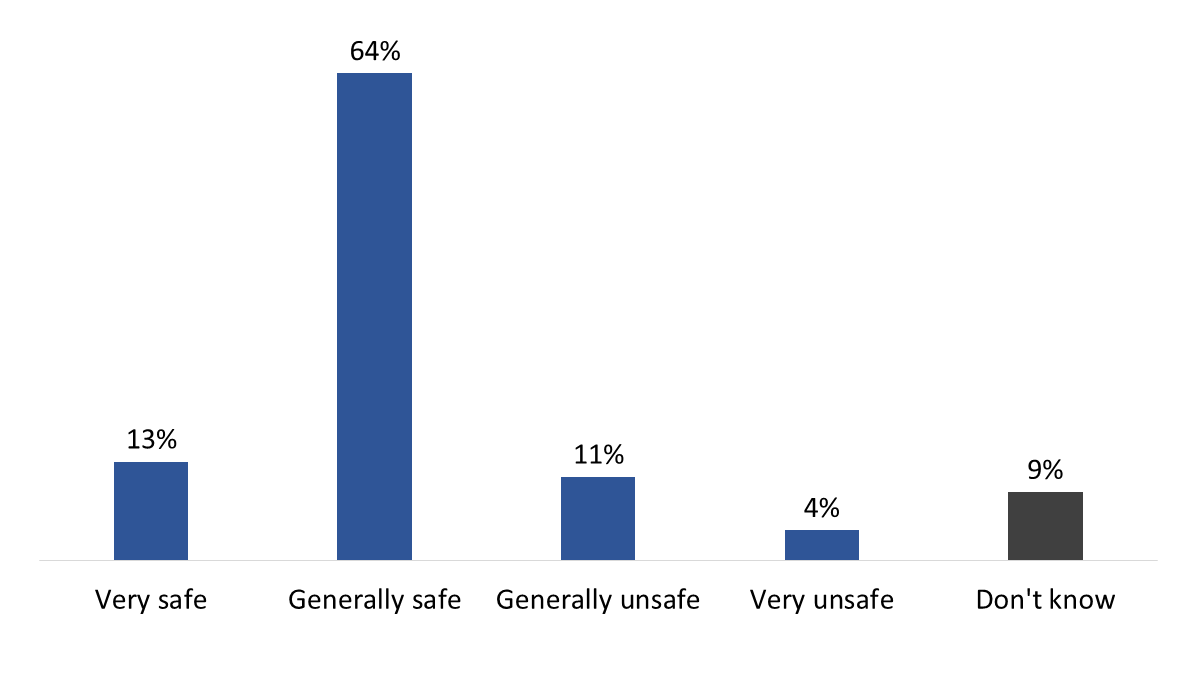
| Very safe | 13% |
| Generally safe | 64% |
| Generally unsafe | 11% |
| Very unsafe | 4% |
| Don't know | 9% |
Q22. How safe do you think it is to transport these [Hazardous materials] things within Canada? Base: n=1,587; all respondents.
Men (81%), residents of Atlantic Canada (85%), and those aged 65 and older (79% compared to 72% of 18- to 34-year-olds) were more likely to think it is safe to transport hazardous materials within Canada.
Half of Canadians think automated vehicles will make roads more dangerous
Based on what they know or may have heard, half of surveyed Canadians said that automated vehicles, or self-driving cars, will make roads somewhat (30%) or much more (21%) dangerous for everyone. Three in 10 think these vehicles will make roads somewhat (23%) or much (8%) safer, while 18% were uncertain.

| Much safer | 8% |
| Somewhat safer | 23% |
| Somewhat more dangerous | 30% |
| Much more dangerous | 21% |
| Not sure | 18% |
Q23. Based on what you know or may have heard, will automated vehicles, or self-driving cars, make roads safer or more dangerous for everyone? Base: n=1,587; all respondents.
The likelihood of thinking that self-driving cars will make roads more dangerous increases with age, from 58% of 18- to 34-year-olds to 72% of those aged 65 and older. Meanwhile, men (46%) and higher-income individuals (39% of those earning $60,000 to $99,999, to 43% of those earning $100,000 to $149,999, to 44% of those earning $150,000 or more) were more likely to think that automated vehicles will make roads safer.
Canadians are most likely to report safety defects to manufacturers or law enforcement
If respondents noticed a safety defect with a vehicle, its tires, or a child car seat, 38% would report this issue to the manufacturer and 31% to local law enforcement. Additionally, 28% would report the defect to government: 17% to Transport Canada, 7% to their provincial or territorial government, and 4% to the Government of Canada. Seven percent of respondents volunteered other organizations, while 8% would not report the defect and 16% were uncertain.
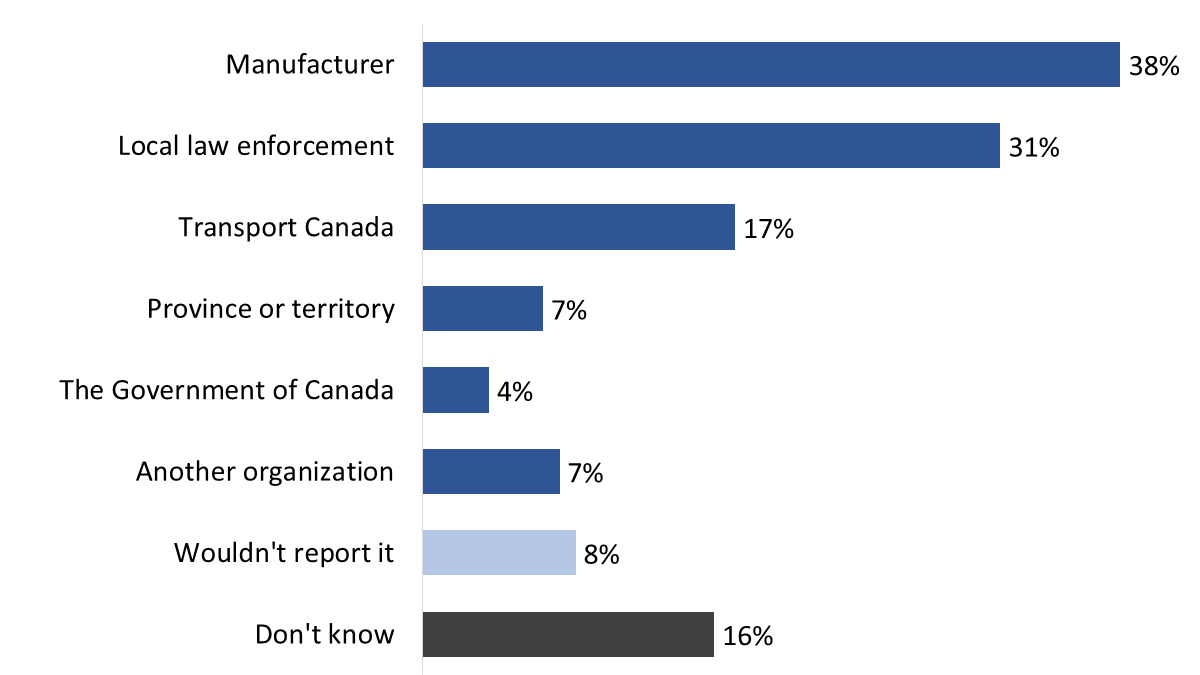
| Manufacturer | 38% |
| Local law enforcement | 31% |
| Transport Canada | 17% |
| Province or territory | 7% |
| The Government of Canada | 4% |
| Another organization | 7% |
| Wouldn't report it | 8% |
| Don't know | 16% |
Q24. If you noticed a safety defect with a vehicle, tires on a vehicle, or a child car seat, who would you report this issue to? Base: n=1,587; all respondents.
Older Canadians (34% of those 55+) were more likely to say they would report a defect to the manufacturer, as well as to local law enforcement (36%) and Transport Canada (21%). Additionally, women were more likely to think they would report defects to the manufacturer (43%), while men (35%) were more likely to point to local law enforcement.
Most were not aware that safety defects can be reported to Transport Canada
Two-thirds (67%) of surveyed Canadians said they are not aware that they can report a safety defect to Transport Canada about vehicles, tires, or child car seats. Meanwhile, 10% are ‘definitely aware’ and 21% are ‘vaguely aware’ of this.

| Definitely aware | 10% |
| Vaguely aware | 21% |
| Not aware | 68% |
Q25. Did you know that you can report a safety defect to Transport Canada about vehicles, tires, or child car seats? Base: n=1,587; all respondents, excluding “don’t know”.
Those aged 55 and older (37%), men (36%) and Indigenous respondents (40%) were more likely to say they are aware that safety defects can be reported to Transport Canada.
Limited recall of transportation safety issues in Canada
Most focus group participants could not recall hearing or seeing anything recently related to transportation safety in Canada. Things that participants did recall related to the following:
Concerns related to transportation safety in Canada often emphasized risks to travellers
Participants raised various concerns about transportation safety in Canada, often highlighting risks to travellers. Such concerns included the following:
Widespread impression that road transportation is less safe than other modes of transportation
Participants widely believed that, compared to other modes of transportation such as air, rail, and water, road transportation is less safe. Reasons informing this impression included the following:
Transportation of hazardous materials in Canada considered safe
There was a widespread impression that the transportation of hazardous materials in Canada is safe. There was recognition that accidents can happen, but a sense that this happens rarely, which is evidence to some that it is safe to transport hazardous materials in Canada. When it came to the comparative safety of various modes of transporting hazardous materials, there was once again general agreement that road transportation is the least safe.
The perceived safety of other modes of transportation, such as rail, water, air, and pipeline, was based mainly on their safety records. The possibility of accidents with these modes was acknowledged (e.g., Lac Mégantic, Exxon Valdez), but such examples were considered rare or exceptional. Rail travel, in particular, tended to be considered safe, not only because of its safety record, but also because trains do not usually encounter traffic or obstacles on their routes, do not run through densely populated areas, and accidents are easier to contain and clean-up if they occur.
The perception that road transportation is less safe than other modes when it comes to transporting hazardous materials was not attributed to data or statistics showing that this is the case. Rather, it was based on the same kinds of reasons informing perceptions that road travel is generally less safe than other modes (e.g., the amount of traffic on roads, the greater likelihood of accidents caused by human error, and adverse weather conditions).
These next questions present Canadians’ views on new technologies and Canada’s transportation system. The survey findings are presented first, followed by the focus group findings.
Most would search online if they needed information on zero-emission vehicles (ZEVs)
If respondents needed information on ZEVs, such as vehicle performance, incentives or availability, 82% would look online. Smaller proportions would look to car dealerships (37%), government websites (37%), and family or friends that drive ZEVs (36%) for this type of information. Additionally, 14% would look to social media, and 4% to other sources.
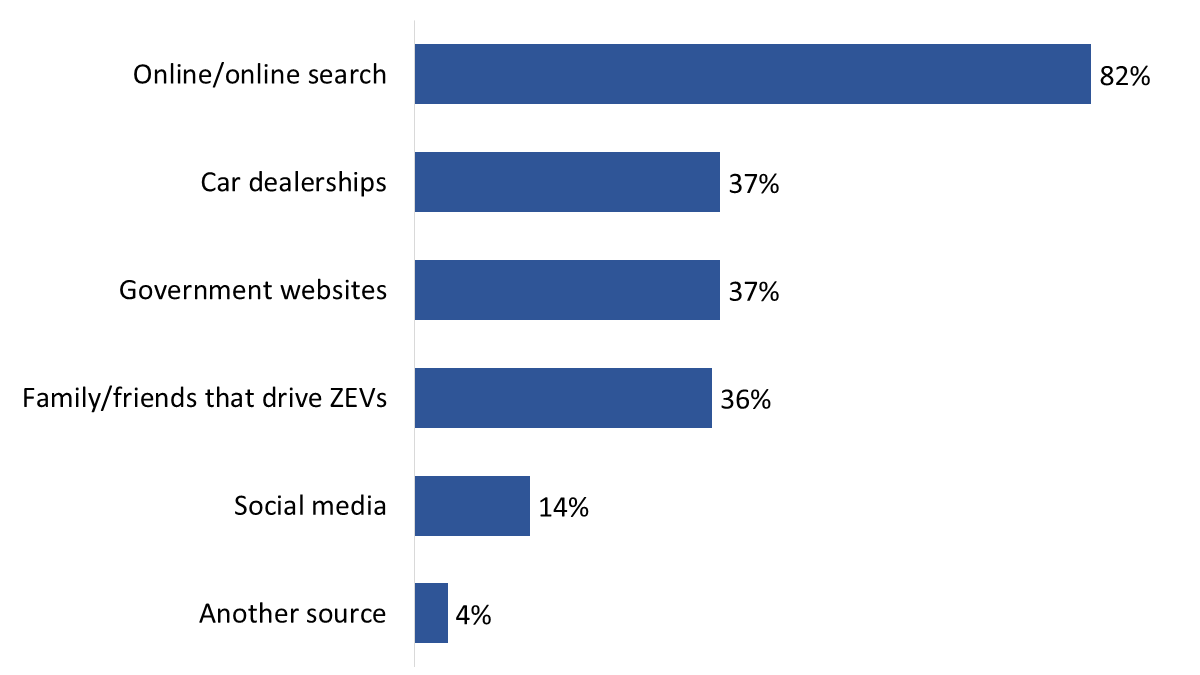
| Online/online search | 82% |
| Car dealerships | 37% |
| Government websites | 37% |
| Family/friends that drive ZEVs | 36% |
| Social media | 14% |
| Another source | 4% |
Q26. If you needed information on zero-emission vehicles, such as vehicle performance, incentive options or availability, where would you look? [Multiple responses accepted] Base: n=1,587; all respondents, excluding “don’t know”.
Older adults (42% of those 55 and older) and women (39%) were more likely to say they would rely on government websites for information on ZEVs, while Prairie residents (27%) were less likely to think they would do so.
Majority are aware that vehicles sold in Canada must be zero-emission by 2035
Just over three-quarters (78%) of respondents are aware that the Government of Canada will require all new cars and light trucks sold in Canada to be zero-emission by 2035, with 43% being definitely aware and 35% vaguely aware. Meanwhile, 22% are not aware of this requirement.
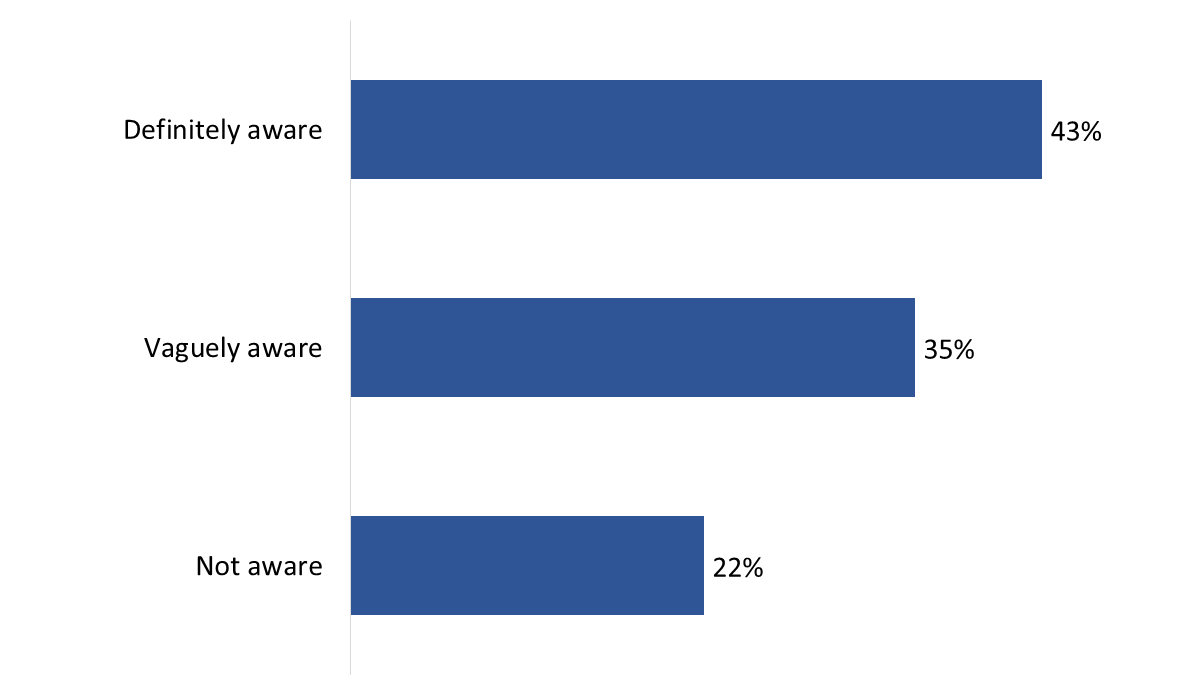
| Definitely aware | 43% |
| Vaguely aware | 35% |
| Not aware | 22% |
Q27. Are you aware that the Government of Canada will require all new cars and light trucks sold in Canada to be zero-emission by 2035? Base: n=1,587; excluding “don’t know”.
Awareness of the 2035 zero-emission mandate is higher among non-Indigenous respondents (78%), men (84%), Quebec residents (88%), and those aged 65 and older (87%). Conversely, individuals earning less than $40,000 per year (67%) are less likely to be aware compared to higher-income groups.
No clear consensus on the 2035 zero-emission mandate
Forty-five percent of surveyed Canadians believe that the requirement for all new cars and light trucks sold in Canada to be zero-emission by 2035 is a good idea, while 39% consider it a bad idea. The remaining 16% were uncertain.
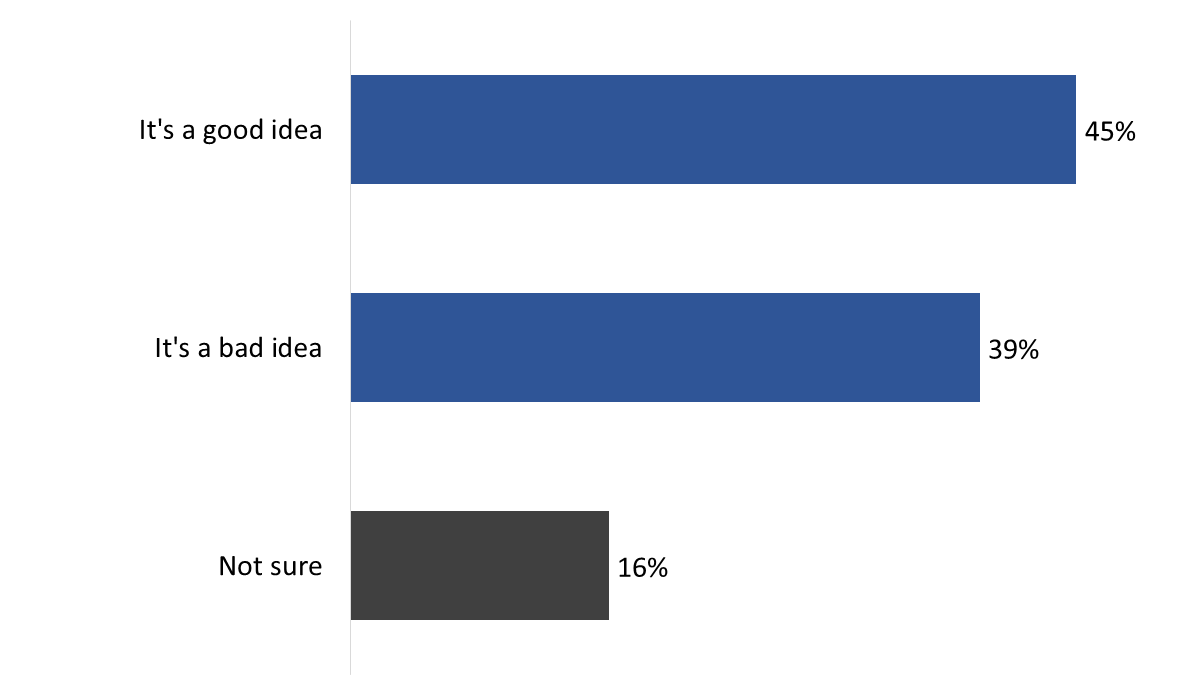
| It's a good idea | 45% |
| It's a bad idea | 39% |
| Not sure | 16% |
Q28. What do you think about the requirement that all new cars and light trucks sold in Canada be zero-emission by 2035? Base: n=1,227; those aware.
Residents of the Prairies (31%), rural and northern Canadians (28%), and Indigenous Peoples (37%) are less likely to view this as a good idea. Conversely, university graduates 54%) and individuals earning less than $40,000 per year (57%) are more likely to support it.
Different views on the Government of Canada’s zero-emission vehicle mandate
There were differing opinions on the Government of Canada’s zero-emission vehicle mandate. Most participants supported the idea, some expressed concerns or did not think it was a good idea, and a few were unsure. Those who supported the mandate provided the following reasons to explain why:
Participants who did not support the mandate or who had doubts about it tended to identify the following types of concerns, usually with a focus on electric vehicles:
Additionally, it was suggested that this is a single solution approach to solving complex problems, with an arbitrary deadline, when what is needed is a more multi-faceted approach.
Participants divided about the effect of cost on their support for zero-emissions vehicles
Participants were divided on whether the higher cost of zero-emissions vehicles would affect their level of support, with some saying yes and others saying no. It was also suggested that zero-emissions vehicles no longer necessarily cost more.
This section of the report presents Canadians’ views on supply chains and the transportation of goods. The survey findings are presented first, followed by the focus group findings.
Few ‘know a lot’ about supply chains
Two in 10 (19%) surveyed Canadians said they ‘know a lot’ about supply chains, while two-thirds (64%) ‘know a little’. Ten percent have heard the term ‘supply chain’ and 7% have no knowledge of supply chains.
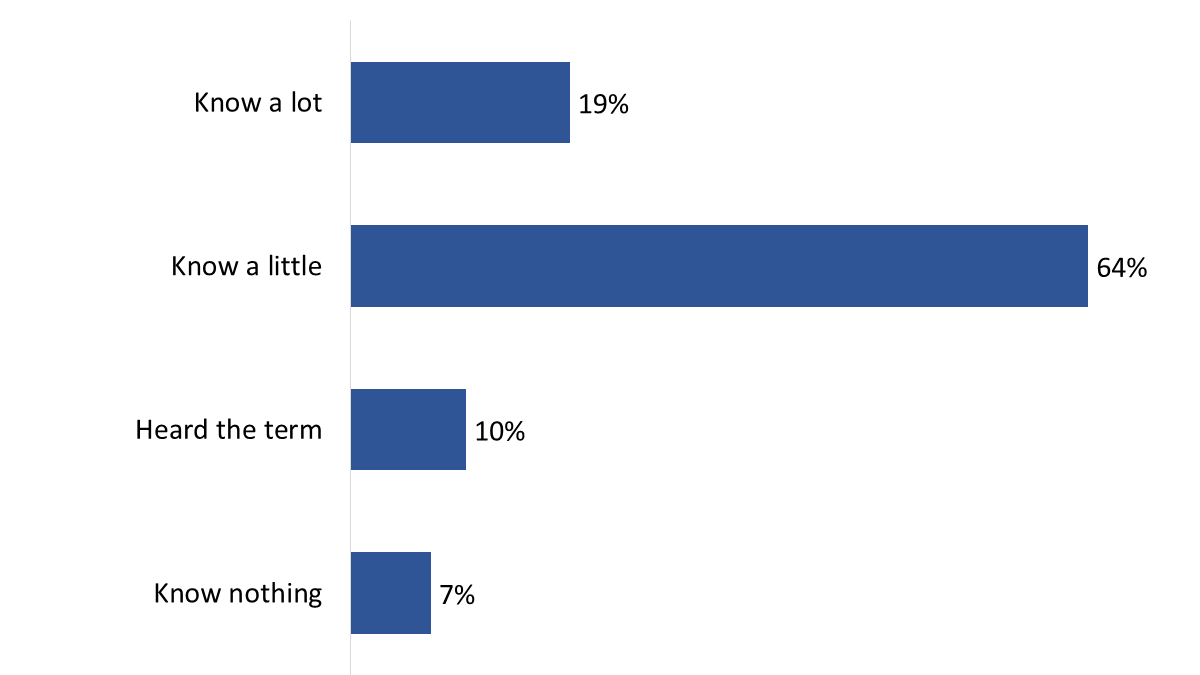
| Know nothing | 7% |
| Heard the term | 10% |
| Know a little | 64% |
| Know a lot | 19% |
Q29. How much do you know about supply chains? Base: n=1,587; all respondents.
Men (89%) were more likely to say they know a little or a lot about supply chains, as were respondents from the West (87%) and Ontario (84%), compared to 77% of Quebec residents. Knowledge also increased with education, from 71% of those with a high school education or less to 86% of university graduates.
Two-thirds have at least some confidence in the strength of Canada’s supply chains
Fifty-eight percent of respondents are somewhat confident in the strength of Canada’s supply chains, while 8% are very confident. In contrast, 28% are not very confident, and 6% are not confident at all.

| Very confident | 8% |
| Somewhat confident | 58% |
| Not very confident | 28% |
| Not at all confident | 6% |
Q30. How confident are you in the strength of Canada’s supply chains? Base: n=1,587; all respondents, excluding “don’t know”.
Confidence in Canada’s supply chains is higher among Quebec residents (76%), women (70%), and those living in urban areas (69%).
Government viewed as most responsible for Canada’s supply chains
When asked who they think is most responsible for managing Canada’s supply chains, half (51%) of respondents chose the Government of Canada, while 37% said industry and businesses. Eleven percent pointed to provincial or territorial governments, and 1% said municipal governments.
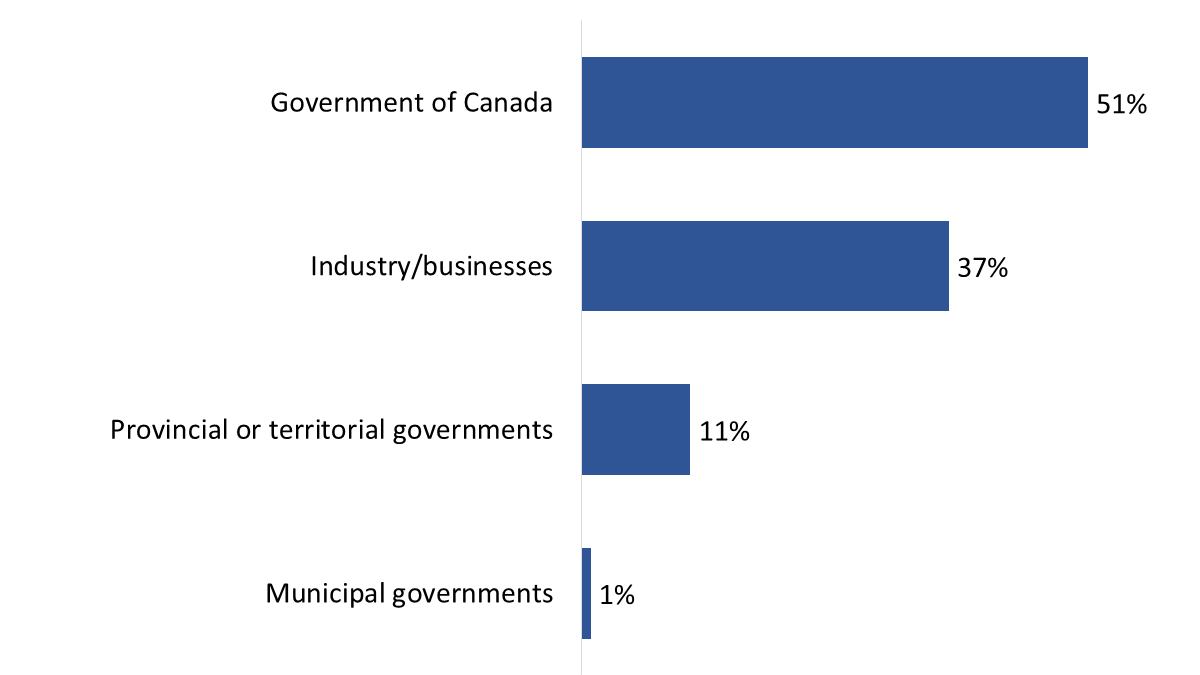
| Government of Canada | 51% |
| Industry/businesses | 37% |
| Provincial or territorial governments | 11% |
| Municipal governments | 1% |
Q31. Who do you think is most responsible for managing Canada’s supply chains? Base: n=1,587; all respondents, excluding “don’t know”.
University graduates (41%) were more likely to consider business and industry to be responsible for managing Canada’s supply chains, while women (56%) and residents of Atlantic Canada (61%) and the Prairies (58%) were more likely to believe that the Government of Canada is most responsible for supply chain management.
Private sector seen as playing a critical role in Canada’s supply chain success
While the largest proportion of respondents said that the Government of Canada is most responsible for managing Canada’s supply chains, many also believe the private sector plays a critical role. Specifically, 65% said service providers like railways, air operators and couriers play a critical role in ensuring Canada’s supply chains deliver goods where they need to go, and another 64% said the same about businesses and industries. Following this, 56% identified infrastructure operators, such as ports and airports, as key players, along with 55% who pointed to the Government of Canada. Fewer respondents mentioned other levels of government—42% cited provincial or territorial governments, and 19% mentioned municipal governments.
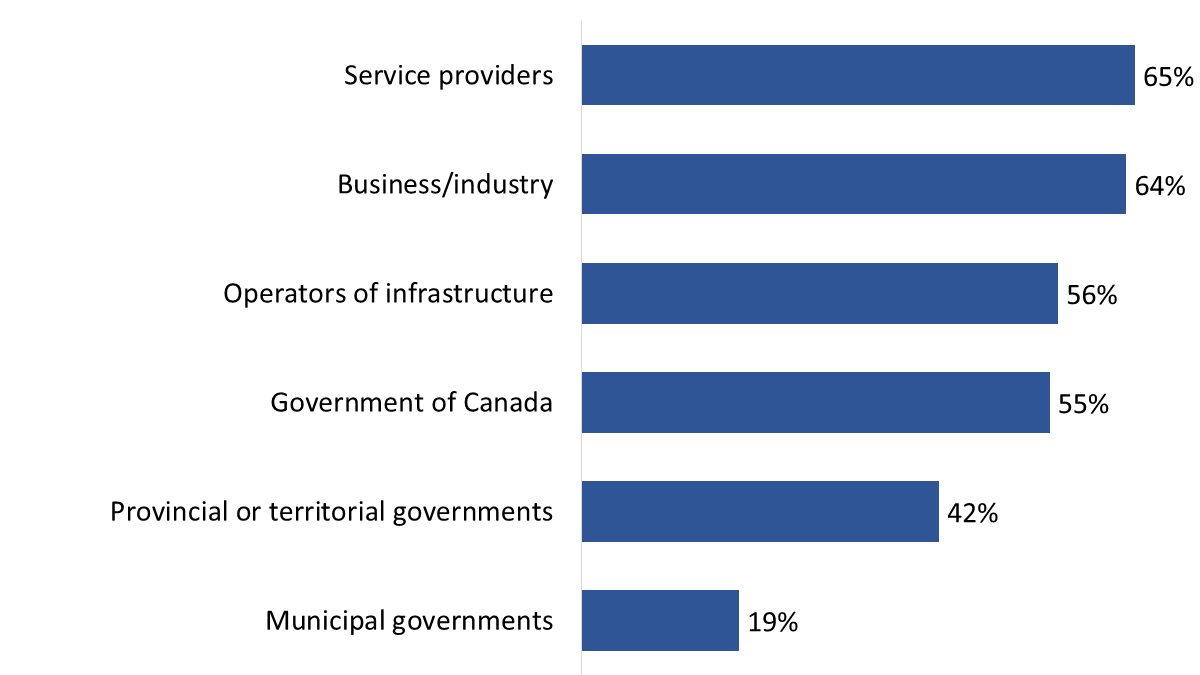
| Service providers | 65% |
| Business/industry | 64% |
| Operators of infrastructure | 56% |
| Government of Canada | 55% |
| Provincial or territorial governments | 42% |
| Municipal governments | 19% |
Q32. Who do you think plays a critical role in ensuring Canada’s supply chains deliver goods where they need to go? [Multiple responses apply] Base: n=1,587; all respondents, excluding “don’t know”.
8 in 10 have at least some confidence in the reliability of Canada’s supply chains
Sixty-seven percent of respondents are somewhat confident that Canada’s supply chains can reliably deliver the goods they need, while 15% are very confident. In contrast, 14% are not very confident, and 3% are not confident at all.
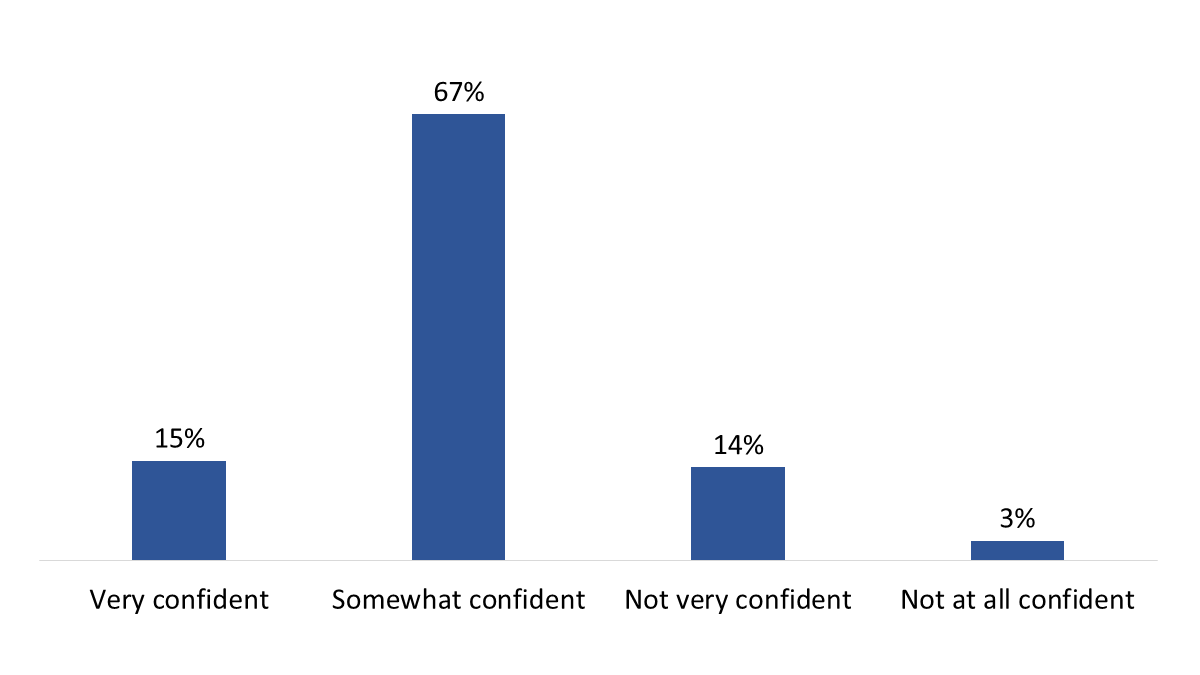
| Very confident | 15% |
| Somewhat confident | 67% |
| Not very confident | 14% |
| Not at all confident | 3% |
Q33. How confident are you that Canada’s supply chains can reliably deliver the goods you need? Base: n=1,587; all respondents, excluding “don’t know”.
Respondents living in urban areas (85%), women (86%), and residents of Atlantic Canada (88%) and Quebec (88%) were more likely than their counterparts to say they have confidence in the reliability of Canada’s supply chains.
Respondents offer a variety of reasons for lacking confidence in Canada’s supply chains
Respondents who are not confident in the ability of Canada’s supply chains to reliably deliver the goods they need (n=271) were asked to explain their concerns in an open-ended format. In response, 30% cited federal government actions and policies, 24% mentioned the risk of disruptions and delays, 19% expressed concerns about inadequate supply chain maintenance, and 17% pointed to Canada’s reliance on imports. The full list of reasons is shown in figure 27.
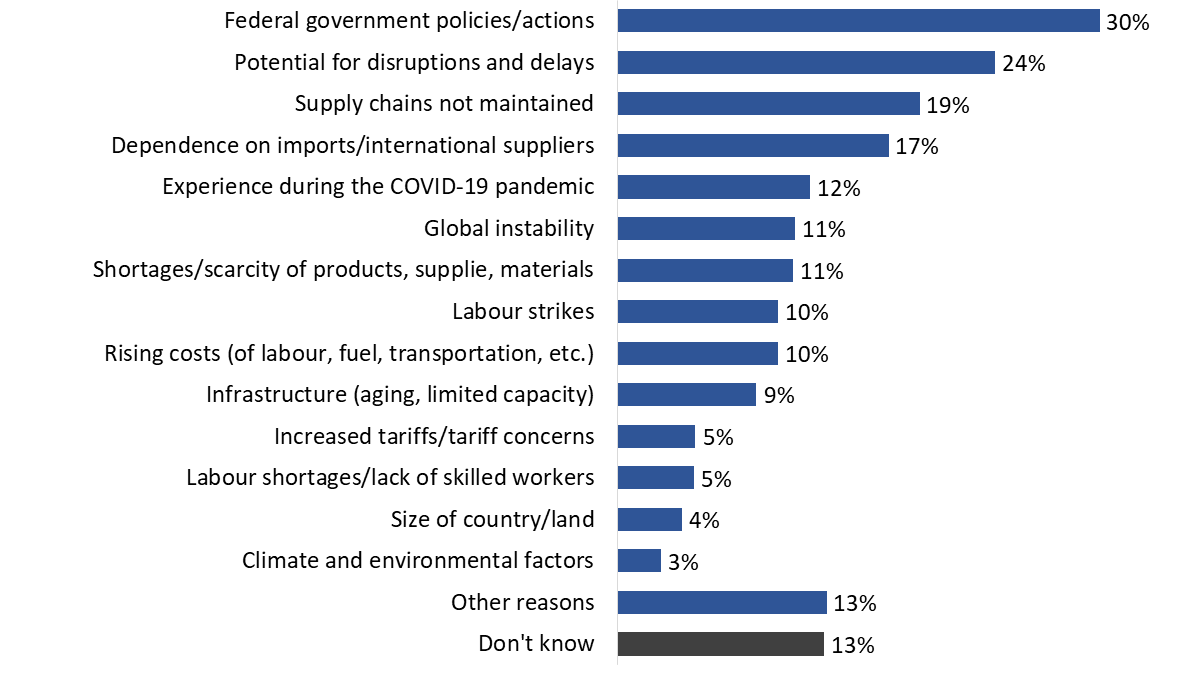
| Federal government policies/actions | 30% |
| Potential for disruptions and delays | 24% |
| Supply chains not maintained | 19% |
| Dependence on imports/international suppliers | 17% |
| Experience during the COVID-19 pandemic | 12% |
| Global instability | 11% |
| Shortages/scarcity of products, supplie, materials | 11% |
| Labour strikes | 10% |
| Rising costs (of labour, fuel, transportation, etc.) | 10% |
| Infrastructure (aging, limited capacity) | 9% |
| Increased tariffs/tariff concerns | 5% |
| Labour shortages/lack of skilled workers | 5% |
| Size of country/land | 4% |
| Climate and environmental factors | 3% |
| Other reasons | 13% |
| Don't know | 13% |
Q34. Why are you [not confident] that Canada’s supply chains can reliably deliver the goods you need? [Multiple responses apply] Base: n=271; those not confident.
Virtually everyone thinks supply chain disruptions will affect them
Most surveyed Canadians think a supply chain disruption could affect them. Specifically, 89% anticipate product shortages, 87% expect price increases, and 77% foresee shipping delays. Additionally, 4% volunteered other potential impacts. Only 1% believe supply chain disruptions will have no personal impact.
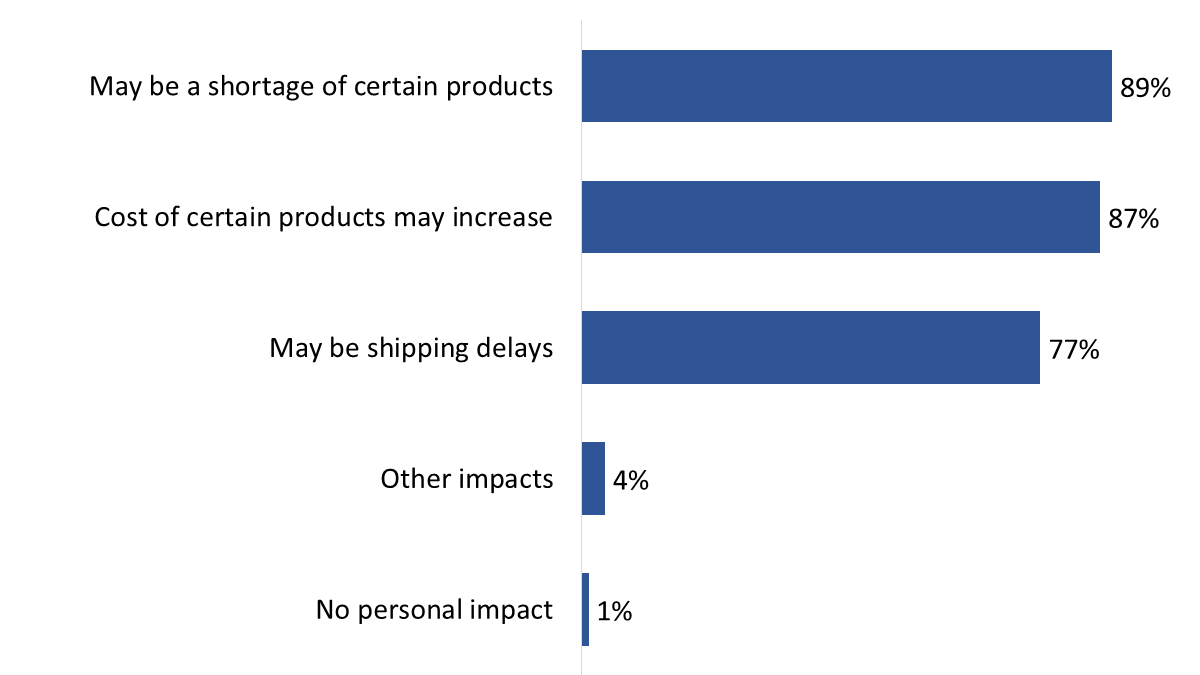
| May be a shortage of certain products | 89% |
| Cost of certain products may increase | 87% |
| May be shipping delays | 77% |
| Other impacts | 4% |
| No personal impact | 1% |
Q35. How, if at all, do you think a disruption in a supply chain might affect you? Base: n=1,587; all respondents, excluding “don’t know”.
Individuals from households earning $150,000 or more were more likely to point to product shortages (93%), price increases (92%) and shipping delays (83%). Younger Canadians were more likely to think that shipping delays might affect them (84% of 18- to 34-year-olds), while residents of the West were more likely to cite price increases (92%) and delays (82%) than those in Ontario and Quebec.
Widespread support for Government of Canada efforts to build supply chain infrastructure
More than nine in 10 (95%) respondents support or strongly support the Government of Canada's efforts to build the necessary supply chain infrastructure. In contrast, 5% oppose these efforts.
Before responding to this question, respondents were informed that strengthening Canada’s supply chains could mean making costly investments in new transportation infrastructure and that transportation infrastructure refers to the network of roads, bridges, railways, airports and shipping ports that support the safe movement of people and goods.
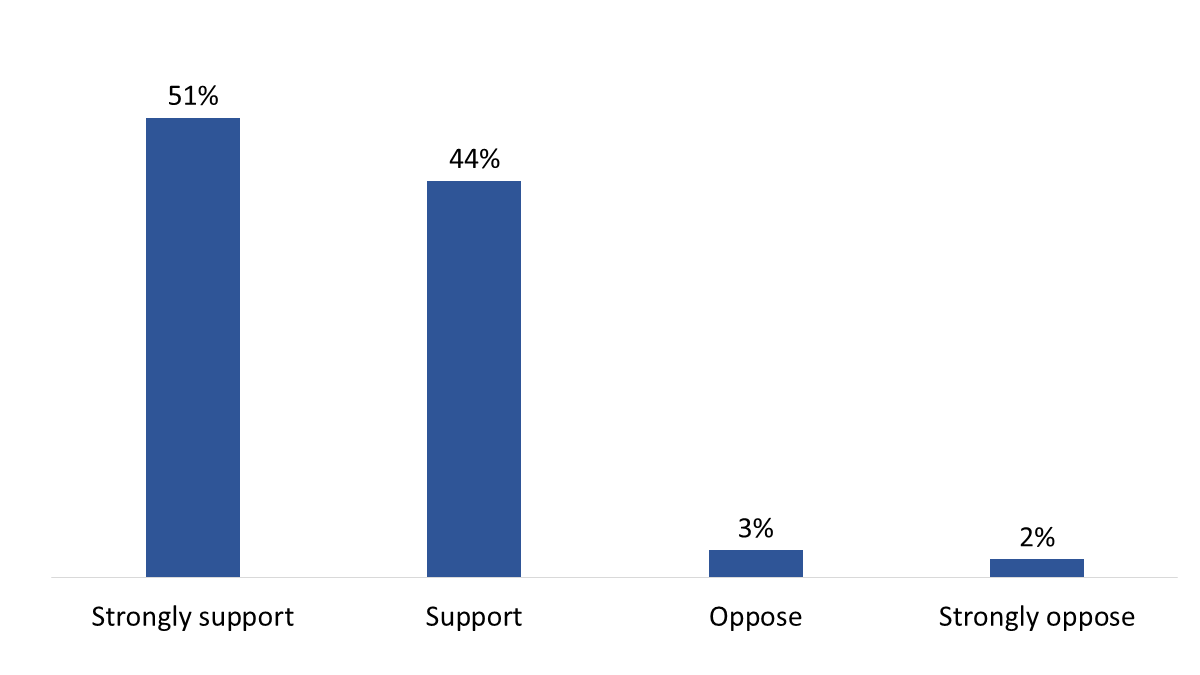
| Strongly support | 51% |
| Support | 44% |
| Oppose | 3% |
| Strongly oppose | 2% |
Q36. How much do you support or oppose Government of Canada efforts to build the necessary supply chain infrastructure? Base: n=1,587; all respondents, excluding “don’t know”.
Most think government should pay for supply chain infrastructure
Sixty-four percent of surveyed Canadians think government should pay for supply chain infrastructure, with 50% saying the Government of Canada, 13% provincial or territorial governments, and 1% municipal governments. Apart from government, 26% believe businesses and industries should be responsible for funding. The remaining 10% were unsure.
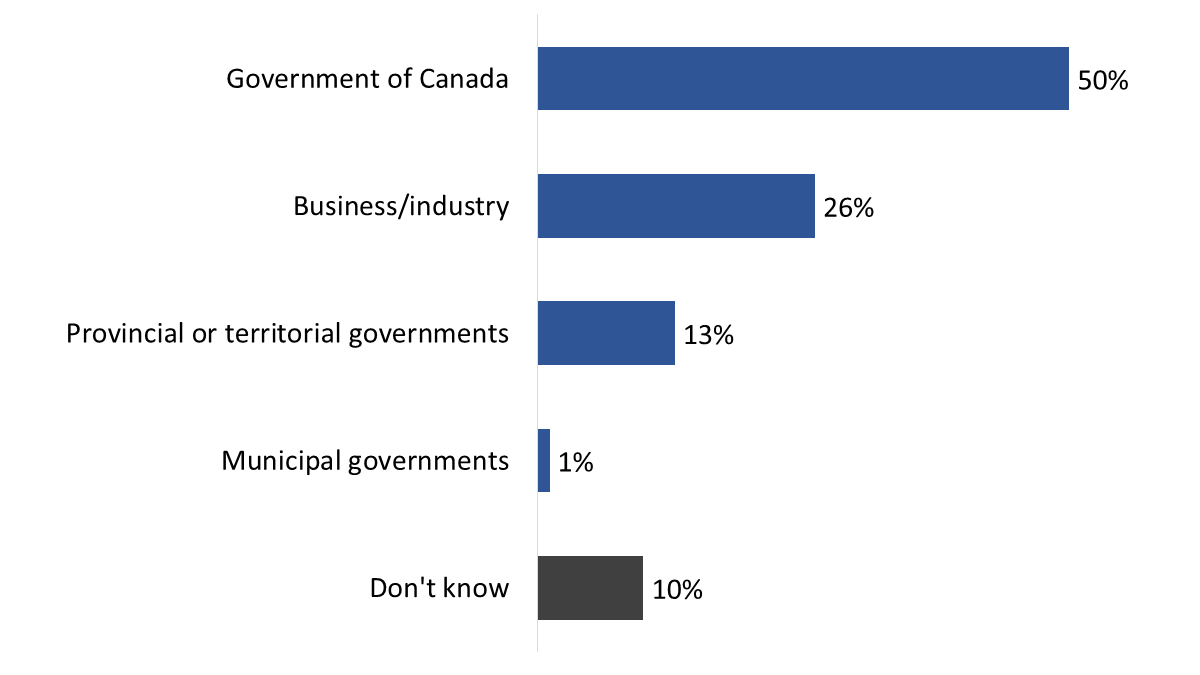
| Government of Canada | 50% |
| Business/industry | 26% |
| Provincial or territorial governments | 13% |
| Municipal governments | 1% |
| Don't know | 10% |
Q37. Who do you think should pay for supply chain infrastructure? Base: n=1,587; all respondents.
Those living in the West (54% compared to 49% of Atlantic Canadians and 46% of Quebec residents) were more likely to say that the Government of Canada should fund this infrastructure.
Vast majority think that marine shipping has at least a small impact on their daily life
Eighty-eight percent of respondents believe marine shipping has some impact on their daily life. Of these, 45% think it has a big impact, 36% a moderate impact, and 13% a small impact. In contrast, 7% said marine shipping has no impact, and 6% were unsure of its impact, if any.
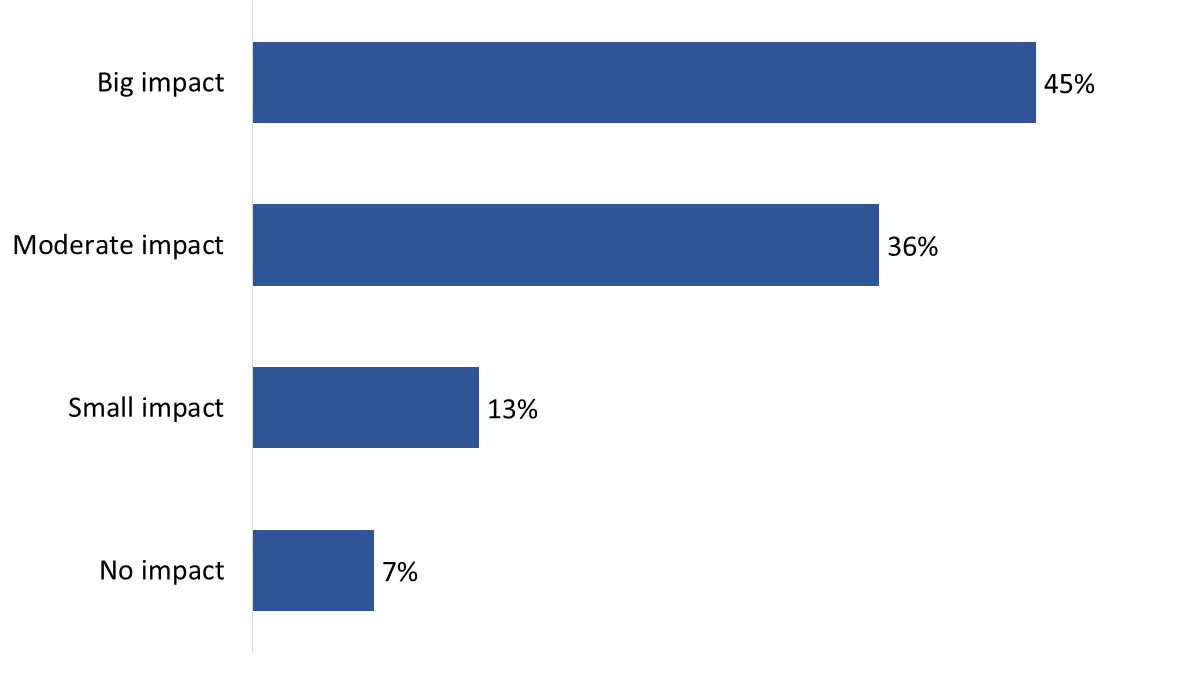
| Big impact | 45% |
| Moderate impact | 36% |
| Small impact | 13% |
| No impact | 7% |
Q38. What impact, if any, do you think marine shipping has on your daily life? Base: n=1,587; all respondents, excluding “don’t know”.
Residents of Atlantic Canada (88%) and British Columbia (88%) were more likely to think that marine shipping has a moderate or big impact on their daily life.
Limited awareness of news about supply chains
Most participants did not recall seeing or hearing anything recently about supply chains. Those who did, recalled seeing or hearing about the impact of the rail and port strikes on supply chains in Canada, the potential impact of tariffs, the effect of the just-in-time (JIT) inventory management strategy, and supply chains recovering from the pandemic years.
Most understand, at least generally, what constitutes a supply chain
Participants did not have any difficulty explaining what, according to them, constitutes or characterizes a supply chain. Explanations included variations on the following:
No consensus on the strength of Canada’s supply chains
Opinions on Canada’s supply chains were mixed. Similar numbers described Canada’s supply chains as strong or somewhere in between strong and weak, while smaller numbers characterized them as weak. Reasons informing these various impressions are provided below.
Strengthening the domestic economy is key to strengthening Canada’s supply chains
The most frequently made suggestion for strengthening Canada’s supply chains was strengthening the country’s domestic economy, with a focus on strengthening the manufacturing sector and other secondary industries, becoming more self-sufficient by purchasing more domestically produced products, and reducing or eliminating interprovincial trade barriers. Other suggestions included:
This section presents Canadians’ views on green transportation. The survey findings are presented first, followed by the focus group findings.
Before being presented these questions, survey respondents were informed that green transportation systems are ways of moving people and goods that are better for the environment because they use less energy, produce less pollution, and often rely on renewable energy sources.
4 in 10 have at least some confidence the government can create green transportation systems
Thirty-eight percent of respondents are somewhat confident in the Government of Canada’s ability to create green transportation systems, while 5% are very confident. In contrast, the majority are not very confident (38%) or not at all confident (19%).
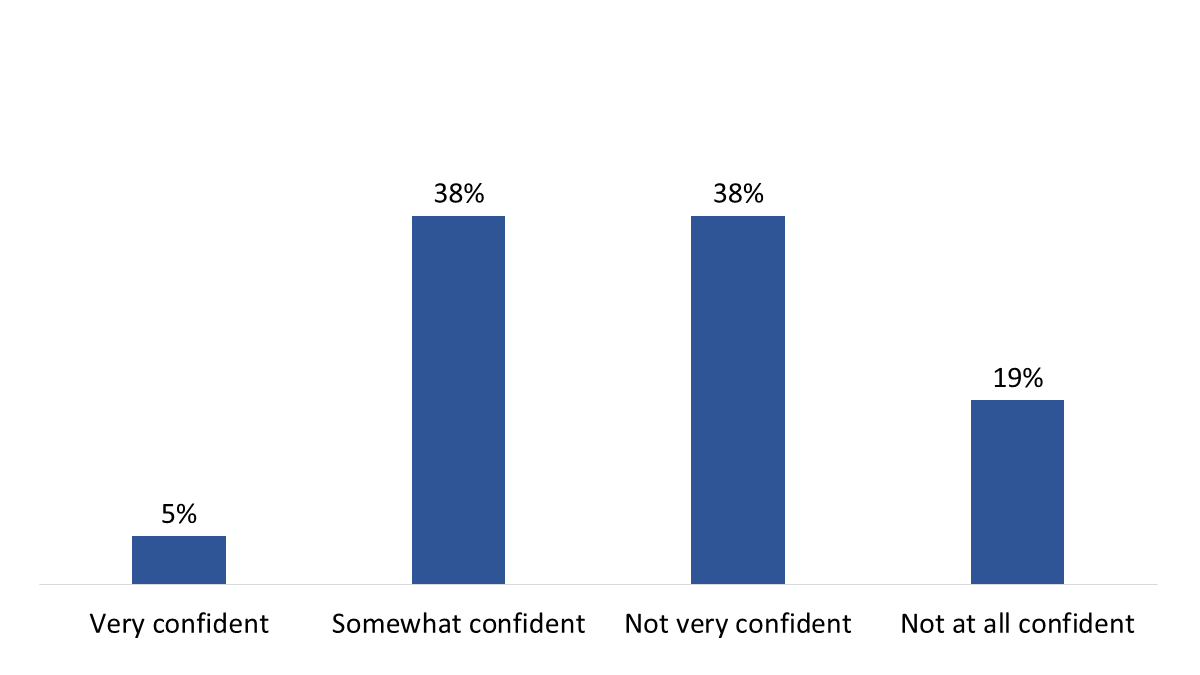
| Very confident | 5% |
| Somewhat confident | 38% |
| Not very confident | 38% |
| Not at all confident | 19% |
Q39. How confident are you in the ability of the Government of Canada to create green transportation systems? Base: n=1,587; all respondents, excluding “don’t know”.
Confidence in the Government of Canada's ability to create green transportation systems is higher among older Canadians (51% of those 65+), women (48%), urban residents (46%), and Quebec residents (49%, compared to 39% in the West).
Seven in 10 support greening transportation even if it costs more money
Seventy-one percent of surveyed Canadians support or strongly support the Government of Canada’s efforts to create green transportation systems, even if it costs more money. In contrast, 28% oppose these efforts, including 15% who strongly oppose them.
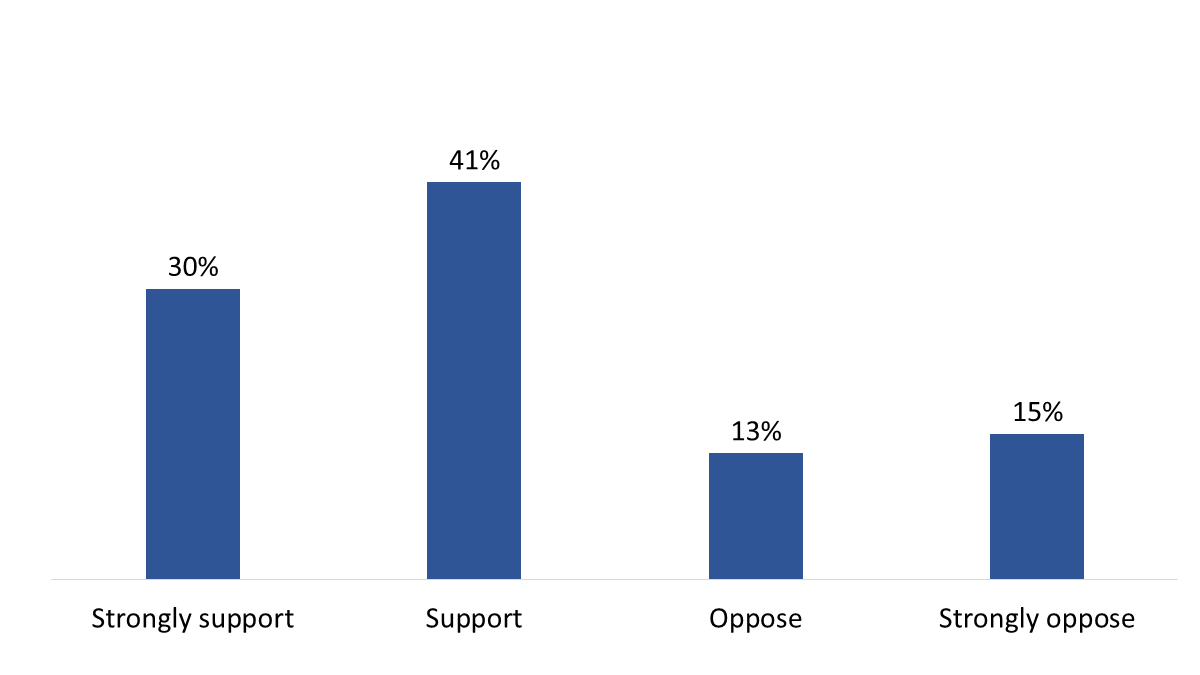
| Strongly support | 30% |
| Support | 41% |
| Oppose | 13% |
| Strongly oppose | 15% |
Q40. If making transportation systems more environmentally friendly will cost more money, how much do you support or oppose the Government of Canada’s efforts to create green transportation systems? Base: n=1,587; all respondents, excluding “don’t know”.
Support for greening transportations systems is higher among 18- to 34-year-olds (76%) and those aged 65 and older (76%), residents of Quebec (84%), women (79%), non-Indigenous respondents (73%), university graduates (80%), and those from urban areas of the country (76%).
Most think Government of Canada investment in green transportation initiatives is important
Three-quarters (76%) of respondents think it is moderately (31%) or very (45%) important that the Government of Canada invests in green transportation initiatives. On the other hand, 24% believe it is not very or not at all important.
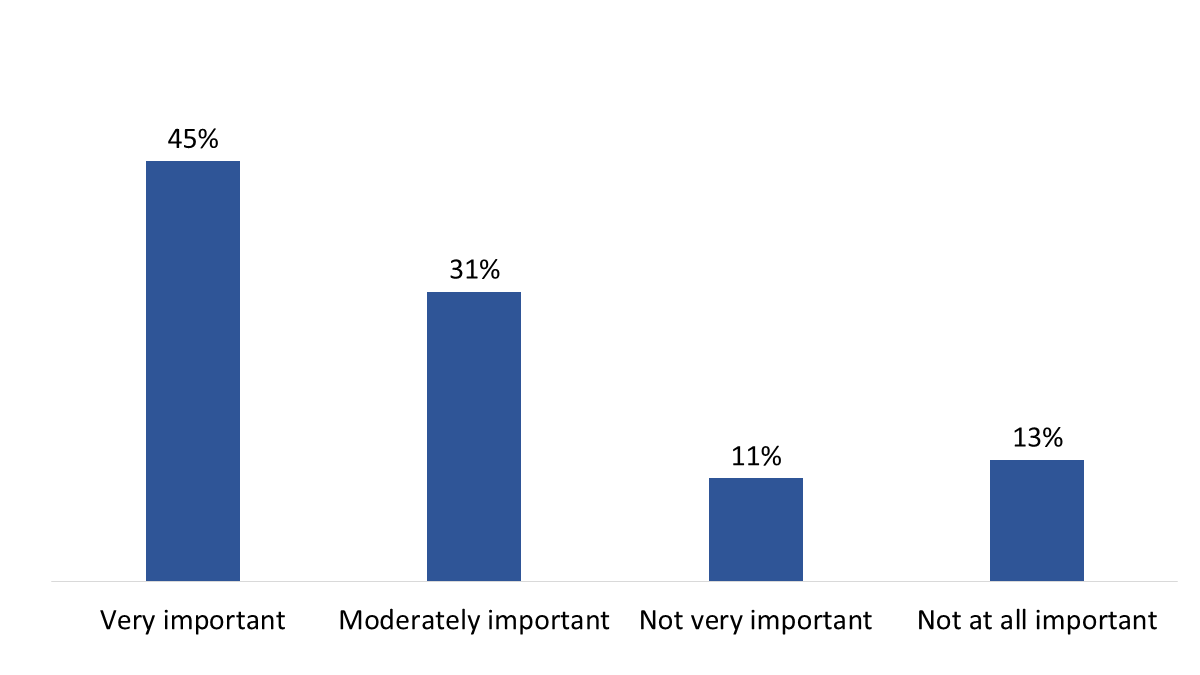
| Very important | 45% |
| Moderately important | 31% |
| Not very important | 11% |
| Not at all important | 13% |
Q41. How important is it that the Government of Canada invests in green transportation initiatives? Base: n=1,587; all respondents, excluding “don’t know”.
Indigenous respondents (31%), men (32%), rural and northern residents (41%), and those aged 35–54 (29%) were more likely to say that investing in these initiatives is not important. Meanwhile, Quebec residents (87%) were the most likely to consider it important.
Reducing the environmental impact of transportation is the biggest environmental concern
Reducing the environmental impact of Canada’s transportation system, including its contribution to air pollution, carbon emissions, and climate change, tended to be seen as the most pressing environmental concern related to transportation in Canada. Specific points made in this regard included the following:
Additional environmental concerns related to transportation that were identified as pressing included the following:
Greening transportation associated mainly with electric vehicles and common transportation
Participants routinely described green transportation as environmentally friendly options that reduce reliance on fossil fuels. This tends to be associated concretely with two things: electric vehicles and public modes of transportation. A few participants also associated green transportation with the use of hydrogen and liquified petroleum gas as alternative fuel options.
Widespread impression that greening of transportation will reduce greenhouse gas emissions
Nearly all participants felt that the greening of transportation will reduce greenhouse gas emissions. In explaining why, participants routinely observed that fuel consuming vehicles are a significant contributor to greenhouse gas emissions, and referred to evidence, data and statistics showing that emissions can be reduced by greening transportation.
The few participants who did not think that the greening of transportation would have an impact on reducing greenhouse gas emissions (or who had their doubts) emphasized the following things to explain their point of view:
Mixed views on government efforts to improve the environmental impact of transportation
Opinions varied on how well the Government of Canada is improving the environmental impact of transportation. Some participants described the federal government’s record as good or moving in the right direction, while others described its efforts as poor, and some were unsure. Those who thought the Government of Canada was performing well sometimes added caveats and qualifications or focused more on the government’s intentions than on actual results. Their reasons included the following:
Participants who felt that the Government of Canada is doing a poor job of improving the environmental impact of transportation provided the following reasons to explain why:
Almost all the Indigenous participants felt that the Government of Canada’s performance has not been good when it comes to including traditional knowledge from Indigenous partners as part of its efforts to reduce greenhouse gas emissions.
Several barriers to electric/hydrogen-powered transportation cited by participants
Perceived barriers to transitioning to electric or hydrogen-powered transportation in Canada fell into three categories:
This section focuses on transportation issues faced by Indigenous communities, and the role of Indigenous communities in the development of transportation infrastructure. This topic was covered in the focus groups only.
Remoteness is the main transportation challenge faced by Indigenous communities
Participants identified remoteness as the primary transportation challenge facing Indigenous communities. This included the following:
The financial aspect of the transportation challenges faced by Indigenous communities (i.e., the high cost of travel, living, and infrastructure maintenance) was described as even more significant because of the limited financial resources of many of these communities.
Indigenous participants were asked how well current transportation policies consider the needs of Indigenous communities. Almost everyone agreed that current transportation policies do not consider the needs of Indigenous communities.
Indigenous communities should be involved in developing transportation infrastructure
There was widespread agreement that Indigenous communities should be directly and fully involved in transportation planning and infrastructure development for their communities, as they have the best understanding of their own needs. Because they know their communities best, it was also suggested that they should take the lead in these efforts. Examples of such involvement included consultations, collaboration, and economic arrangements such as joint ventures and partnerships.
This section presents Canadians’ views on information sources and transportation information. The survey findings are presented first, followed by the focus group findings.
Online searches are the top source for transportation-related information
Surveyed Canadians were asked where they would look if they wanted information on transportation. In response, most (89%) said online searches. All other sources were mentioned by 14% of respondents or fewer, as shown in Figure 35.
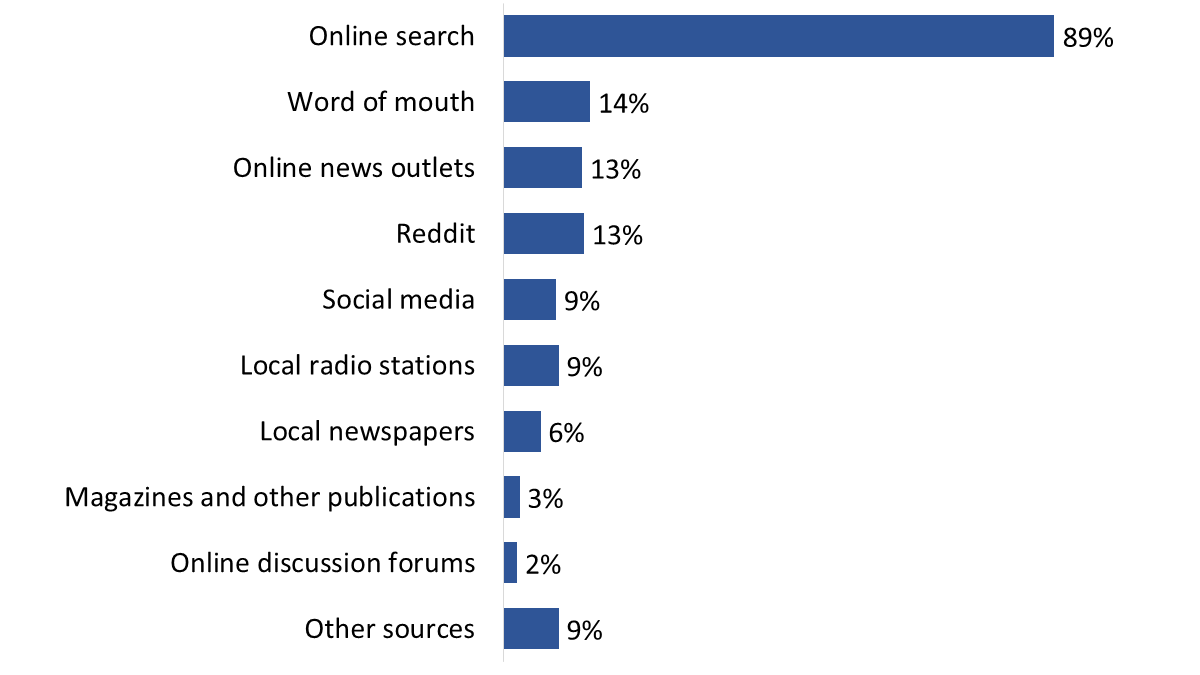
| Online search | 89% |
| Word of mouth | 14% |
| Online news outlets | 13% |
| 13% | |
| Social media | 9% |
| Local radio stations | 9% |
| Local newspapers | 6% |
| Magazines and other publications | 3% |
| Online discussion forums | 2% |
| Other sources | 9% |
Q42. If you wanted information on transportation, where would you look? [Multiple responses accepted] Base: n=1,587; all respondents, excluding “don’t know”.
Younger Canadians were more likely to say they would rely on word of mouth (20% of 18- to 34-year-olds), Reddit (29%), and social media (12%), while older Canadians (65+) were more likely to point to local newspapers (12%).
For half, the federal government is the most trusted source for transportation information
When asked who they would trust the most to provide information about Canada’s transportation system, the largest proportion (51%) said the Government of Canada. Other sources were mentioned by 14% or fewer, as shown in Figure 36.

| Government of Canada | 51% |
| Canadian not-for-profit organizations representing the sector | 14% |
| Provincial or territorial government | 11% |
| News media | 9% |
| Business/industry | 6% |
| Social media | 4% |
| Municipal government | 3% |
| Another source | 3% |
Q43. Who would you trust the most to provide information about Canada’s transportation system? Base: n=1,587; all respondents, excluding “don’t know”.
Majorities rely on Canadian media and internet searches the most for information or news
Just over half of respondents rely most often on Canadian TV, radio channels, and newspapers (60%) as well as internet searches (55%) for information or news. Following these, 39% rely on the Government of Canada, 34% on scientific experts and reports, and 31% on provincial and territorial governments. The full list of sources can be found in Figure 37.
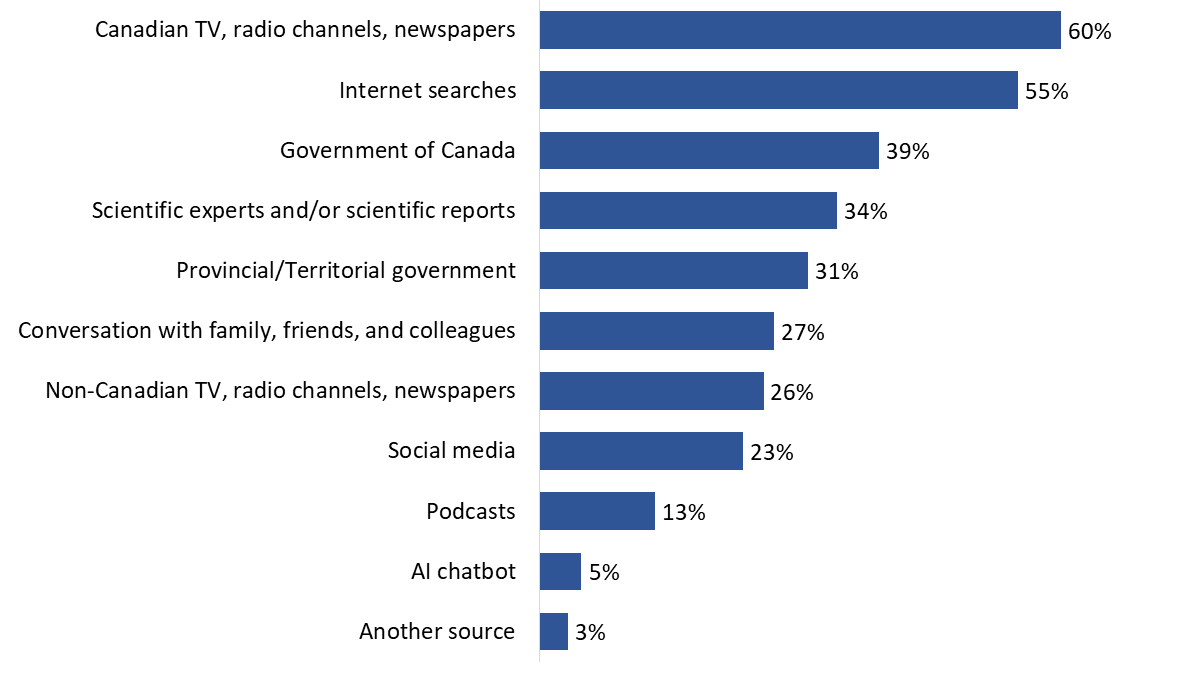
| Canadian TV, radio channels, newspapers | 60% |
| Internet searches | 55% |
| Government of Canada | 39% |
| Scientific experts and/or scientific reports | 34% |
| Provincial/Territorial government | 31% |
| Conversation with family, friends, and colleagues | 27% |
| Non-Canadian TV, radio channels, newspapers | 26% |
| Social media | 23% |
| Podcasts | 13% |
| AI chatbot | 5% |
| Another source | 3% |
Q44. Which of the following sources do you rely on most often for information or news? [Multiple responses accepted] Base: n=1,587; all respondents, excluding “don’t know”.
University graduates (65%), residents of Atlantic Canada (71%) and Ontario (61%), women (64%), and those aged 65 and older (70%) are more likely to rely most often on Canadian TV, radio, and newspapers.
Canadians are interested in a variety of transportation topics
When asked what, if anything, they would like to know more about in relation to Canada’s transportation system, 41% mentioned infrastructure projects, 35% clean energy options, and 31% road safety. Additionally, 28% would like to know more about air passenger rights, 24% about rules and regulations, and 22% each about supply chains or safety information. The full list of topics can be found in Figure 38.
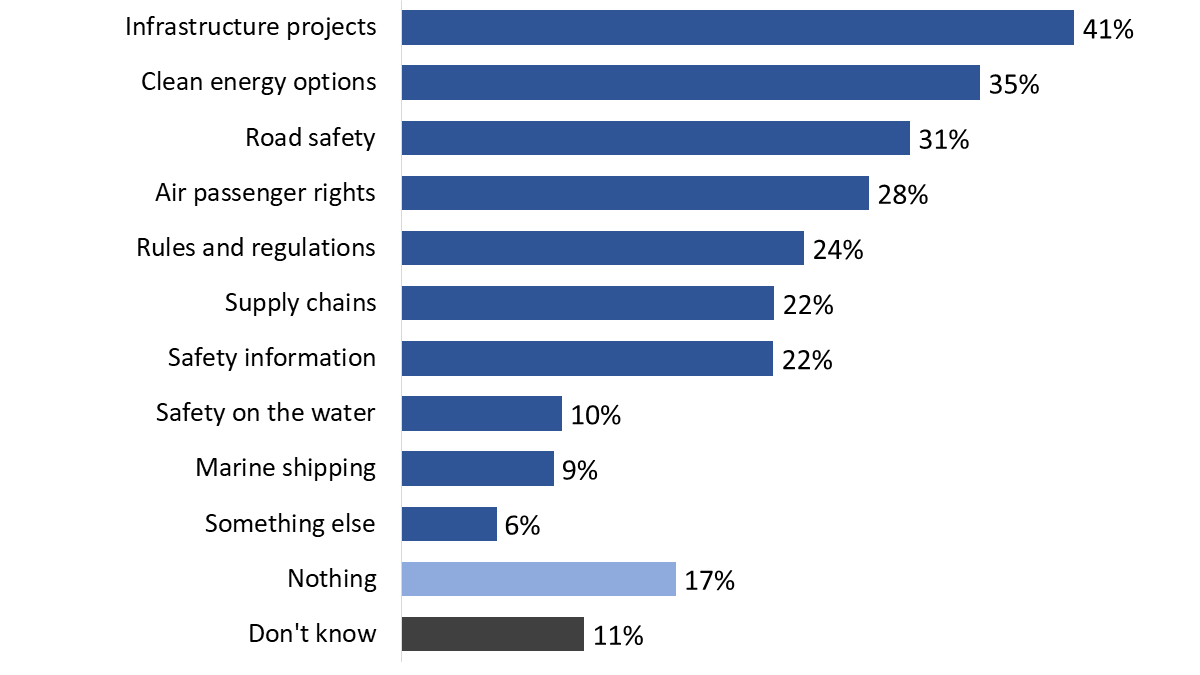
| Infrastructure projects | 41% |
| Clean energy options | 35% |
| Road safety | 31% |
| Air passenger rights | 28% |
| Rules and regulations | 24% |
| Supply chains | 22% |
| Safety information | 22% |
| Safety on the water | 10% |
| Marine shipping | 9% |
| Something else | 6% |
| Nothing | 17% |
| Don't know | 11% |
Q45. Thinking about Canada’s transportation system, what, if anything, would you like to know more about? [Multiple responses accepted] Base: n=1,587; all respondents.
Participants consult various news sources for various reasons
Participants collectively identified a variety of sources they tend to rely on for information and news. These included ‘traditional’ Canadian media sources (e.g., CBC, CTV, Global), international sources (e.g., BBC, CNN, Reuters), independent sources (e.g., Substack), and local or regional sources (e.g., Tyee, Journal de Montreal), social media (e.g., X/Twitter, Reddit), and news aggregators (e.g., Ground News, Flipboard, Google News). Reasons for relying on these included wanting neutral or balanced reporting (i.e., absence of bias), a range of opinions or points of view, or a good curation of sources, along with interest in a specific level of focus (i.e., local, national, international), a preference for independent sources (i.e., not publicly or corporately funded), and thoughtful commentary.
A number of factors are used to differentiate between reliable and unreliable sources
According to participants, the following factors allow them to distinguish a reliable news source from an unreliable one:
Government of Canada is trusted as an information source for Canada’s transportation system
The Government of Canada was routinely identified as the most trusted source of information about Canada’s transportation system. This trust was occasionally accompanied by qualifications, including ensuring accessibility to such information, providing supporting data, and allowing third parties, such as investigative journalists or industry stakeholders, to examine or verify information. Reasons for trusting the government of Canada included the following:
Generally, participants believed that all Government of Canada communications channels are trustworthy for receiving information about Canada’s transportation system, provided it is clear the information comes directly from the Government of Canada. Government of Canada websites were often identified as the most trusted communication channel because they are repositories for comprehensive and detailed information and individuals can search them for specific information.
By way of comparison, it was observed that social media ‘pushes’ information to individuals, whereas websites require people to seek out information themselves. While this does not necessarily make social media a less trustworthy source of government information, some noted that when governments use social media to push information, it can have a public relations aspect to it—for example, promoting a certain agenda or highlighting their achievements.
Some participants linked the communications channel to the substance or subject-matter. For example, it was suggested that government websites are the best source for information that is detailed and/or comprehensive, while social media is an effective vehicle for short government communications such as advisories, alerts, updates, press releases, and awareness-raising campaigns.
List of suggestions offered to improve the accessibility and clarity of Government of Canada communications
Participants identified various ways in which the Government of Canada could improve accessibility and clarity in its communications. Suggestions included the following:
The following specifications applied to the survey:
| Total (n) | |
|---|---|
| Total phone numbers attempted = I + U + IS + R | 18,103 |
| Out-of-scope - Invalid (I) | 646 |
| Unresolved (U) | 10,234 |
| In-scope - Non-responding (IS) | 5,616 |
| Language problem, illness, incapable | 4 |
| Household refusal | 427 |
| Respondent refusal | 5,100 |
| Qualified respondent break-off/partial complete | 85 |
| In-scope - Responding units (R) | 1,607 |
| Completed the survey | 1,587 |
| Terminate, prefer not provide province/territory or gender | 1 |
| Terminate, not 18 years of age | 19 |
| Response rate = R / (U + IS + R) | 9.2% |
| Variable | % Unweighted |
% Weighted |
|---|---|---|
| Gender | ||
| Men | 50% | 49% |
| Women | 50% | 51% |
| RegionFootnote 2 | ||
| Atlantic Canada | 8% | 7% |
| Quebec | 20% | 23% |
| Ontario | 38% | 39% |
| West | 34% | 31% |
| Age | ||
| 18-34 | 20% | 27% |
| 35-54 | 36% | 32% |
| 55+ | 44% | 41% |
| Indigenous | ||
| Indigenous | 15% | 5% |
| Not Indigenous | 85% | 95% |
The following specifications applied to the survey:
| February 18 | February 18 | February 19 | February 19 | February 20 |
|---|---|---|---|---|
| Group 1 | Group 2 | Group 3 | Group 4 | Group 5 |
| English-language Ontario 6:00 pm Eastern |
English-language West 8:00 pm Eastern |
English-language Atlantic 5:00 pm Eastern |
French-language Quebec 7:00 pm Eastern |
Indigenous Peoples 7:00 pm Eastern |
The tables in this section present profiles of the research participants.
| Province/Territory | Weighted percentage of the survey sample |
|---|---|
| Atlantic Canada | 7% |
| Quebec | 23% |
| Ontario | 39% |
| Prairies | 16% |
| British Columbia | 15% |
| Territories | <0.5% |
| Gender | Weighted percentage of the survey sample |
|---|---|
| Men | 47% |
| Women | 50% |
| Another gender | 2% |
| Prefer not to answer | 1% |
| Age | Weighted percentage of the survey sample |
|---|---|
| 18 to 24 years old | 2% |
| 25 to 34 years old | 24% |
| 35 to 54 years old | 32% |
| 55 years old or older | 41% |
| Education | Weighted percentage of the survey sample |
|---|---|
| Elementary school or less | 2% |
| Secondary school | 9% |
| Registered Apprenticeship or other trades certificate or diploma | 7% |
| College, CEGEP or other non-university certificate or diploma | 22% |
| University certificate or diploma below bachelor’s level | 8% |
| Undergraduate university program | 28% |
| Post graduate degree above bachelor’s level | 23% |
| Prefer not to answer | 2% |
| Household income | Weighted percentage of the survey sample |
|---|---|
| Under $40,000 | 10% |
| $40,000 to just under $60,000 | 9% |
| $60,000 to just under $80,000 | 10% |
| $80,000 to just under $100,000 | 15% |
| $100,000 to just under $150,000 | 23% |
| $150,000 and above | 22% |
| Prefer not to answer | 10% |
| Disability | Weighted percentage of the survey sample |
|---|---|
| No disability | |
| Living with a disability | |
| No response |
| Indigenous person | Weighted percentage of the survey sample |
|---|---|
| Indigenous | 4% |
| Non-Indigenous | 91% |
| Prefer not to answer | 5% |
| Language spoken at home *Multiple responses accepted |
Weighted percentage of the survey sample |
|---|---|
| English | 78% |
| French | 18% |
| Other languages | 4% |
| Prefer not to answer | 1% |
| Location | Weighted percentage of the survey sample |
|---|---|
| Urban | 78% |
| Rural and north | 6% |
| Prefer not to answer | 16% |
| Region | Number of focus group participants |
|---|---|
| West and Territories | 14 |
| Ontario | 9 |
| Quebec | 9 |
| Atlantic | 6 |
| Indigenous | Number of focus group participants |
|---|---|
| Indigenous | 9 |
| Non-Indigenous | 29 |
| Age | Number of focus group participants |
|---|---|
| 18 to 35 | 8 |
| 35 to 54 | 10 |
| 45 to 64 | 13 |
| 65+ | 7 |
| Gender | Number of focus group participants |
|---|---|
| Man | 21 |
| Woman | 17 |
| Education | Number of focus group participants |
|---|---|
| High school or less | 6 |
| College, trades, some university | 6 |
| University graduates | 26 |
Survey Introduction
Thank you for agreeing to take part in this survey being conducted by Phoenix Strategic Perspectives (Phoenix SPI) on behalf of the Government of Canada. Si vous préférez répondre au sondage en français, veuillez cliquer sur « Français » dans le coin supérieur droit.
This survey is designed to collect information on issues of importance to Canadians. The survey should take no more than 15 minutes to complete, is voluntary, and your responses will be kept completely confidential. The information provided will be administered according to the requirements of the Privacy Act. Your responses will not be used to identify you, and none of your opinions will be attributed to you personally in any way. To view Phoenix SPI’s privacy policy, click <here>.
This survey is registered with the Canadian Research Insights Council’s Research Verification Service. The project verification code is INSERT. Click <here> to verify the legitimacy of this survey.
The survey conforms with the Web Content Accessibility Guidelines designed to ensure websites and digital content are more accessible for people with disabilities. Should you require an alternate method of completing this survey, please click <here> to contact us.
Screener
1. Which of the following age groups do you fall into?
2. Where are you located?
3. For the purposes of this survey, will you please provide your gender?
4. Are you First Nations, Métis, or Inuk (Inuit)?
Select all that apply
Transportation Profile
These next questions are about the types of transportation you use for any reason, like your daily activities, work or school, vacations, or anything else.
5. Which of the following have you done in the last 12 months?
Select all that apply
6. In the last 12 months, how many times did you use the following methods of transportation?
[INSERT ITEMS FROM Q5]
[RESPONSE OPTIONS]
7. [IF Q6A, B OR C = 06] On average, how frequently do you use the following methods of transportation in a typical month?
[INSERT ITEMS FROM Q6]
[RESPONSE OPTIONS]
8. Do you live within 25 kms of any of the following?
Select all that apply
[RANDOMIZE LIST]
9. What is your main way of getting around on a typical day?
[RANDOMIZE LIST]
10. [IF Q9=01] What type of energy source powers your vehicle?
[RANDOMIZE LIST]
11. [IF Q9=01] Is your next new vehicle going to be:
[RANDOMIZE ITEMS]
12. Which, if any, of the following apply to you?
Select all that apply
*This does not include boats used for commercial purposes, such as fishing boats, tour boats, ferries, or cruise ships.
13. [IF Q12=01, 02] Do you use your boat for…?
14. [IF Q12=01, 02] What type of boat do you own or rent?
Select all that apply
[RANDOMIZE LIST]
Perceptions of Transport Canada and its initiatives
These next questions are about Canada’s transportation system. By transportation system, we are referring to roads, bridges, railways, airports, and ports that support the movement of people and goods within Canada.
15. Who is most responsible for a safe and secure transportation system in Canada?
[RANDOMIZE ITEMS]
Transport Canada is the department within the federal government responsible for overseeing the federally regulated transportation system in Canada. This includes transportation policies, programs, and safety regulations across all modes of transportation that support the movement of people and goods within Canada.
16. What’s your overall impression of Transport Canada?
Safety and Security
17. These next questions are about safety and security in Canada’s transportation system. How confident are you in the overall safety of Canada’s transportation system? By transportation system, we are referring to bridges, railways, airports, and ports that support the movement of people and goods within Canada.
18. Overall, how safe do you think it is to travel within Canada, whether by road, rail, air or water?
19. How would you rate the overall safety of each of the following?
[RANDOMIZE ITEMS]
[RESPONSE OPTIONS]
20. Please rate Transport Canada’s* performance in the following areas:
[RANDOMIZE ITEMS]
*Transport Canada is the department within the federal government responsible for overseeing the federally regulated transportation system in Canada. This includes transportation policies, programs, and safety regulations across all modes of transportation that support the movement of people and goods within Canada.
[RESPONSE OPTIONS]
21. What do you believe is the biggest threat to road safety in Canada?
[RANDOMIZE ITEMS]
22. Hazardous materials are substances that could be dangerous to health, safety, property or the environment, such as pesticides, fireworks, chemicals, or gasoline. How safe do you think it is to transport these things within Canada?
23. Based on what you know or may have heard, will automated vehicles, or self-driving cars, make roads safer or more dangerous for everyone?
24. If you noticed a safety defect with a vehicle, tires on a vehicle, or a child car seat, who would you report this issue to?
Select all that apply
[RANDOMIZE ITEMS]
25. Did you know that you can report a safety defect to Transport Canada about vehicles, tires, or child car seats?
New Technologies
These next questions are about technology and Canada’s transportation system.
26. If you needed information on zero-emission vehicles, such as vehicle performance, incentive options or availability, where would you look? Zero-emission vehicles, or ZEVs, refer to vehicles that typically rely on alternative power sources like electricity, hydrogen, or other renewable energy.
Select all that apply
[RANDOMIZE LIST]
27. Are you aware that the Government of Canada will require all new cars and light trucks sold in Canada to be zero-emission by 2035?
28. [If Q31=01, 02] What do you think about the requirement that all new cars and light trucks sold in Canada be zero-emission by 2035?
Supply Chains
These next questions are about the transportation of goods.
29. How much do you know about supply chains?
A supply chain is a path that products take to get from where they are made to where they are sold. Depending on the product, this path may include multiple countries and companies, with materials and parts coming from all over the world.
30. How confident are you in the strength of Canada’s supply chains?
31. Who do you think is most responsible for managing Canada’s supply chains?
32. Who do you think plays a critical role in ensuring Canada’s supply chains deliver goods where they need to go?
Select all that apply
[RANDOMIZE LIST]
33. How confident are you that Canada’s supply chains can reliably deliver the goods you need?
34. [IF Q37=03, 04] Why are you not very or not at all confident that Canada’s supply chains can reliably deliver the goods you need?
35. How, if at all, do you think a disruption in a supply chain might affect you?
Select all that apply
[RANDOMIZE LIST]
36. Strengthening Canada’s supply chains could mean making costly investments in new transportation infrastructure. Transportation infrastructure refers to the network of roads, bridges, railways, airports and shipping ports that supports the safe movement of people and goods. How much do you support or oppose Government of Canada efforts to build the necessary supply chain infrastructure?
37. [IF Q40=03, 04] Why do you not support Government of Canada efforts to build the transportation infrastructure needed to strengthen Canada’s supply chains?
38. Who do you think should pay for supply chain infrastructure?
Select all that apply
[RANDOMIZE LIST]
39. ‘Marine shipping’ refers to moving goods by ship from one place to another across seas and rivers, and along coastlines. What impact, if any, do you think marine shipping has on your daily life?
Green initiatives
These next questions are on green transportation. Green transportation systems are ways of moving people and goods that are better for the environment because they use less energy, produce less pollution, and often rely on renewable energy sources.
40. How confident are you in the ability of the Government of Canada to create green transportation systems?
41. If making transportation systems more environmentally friendly will cost more money, how much do you support or oppose the Government of Canada’s efforts to create green transportation systems?
42. How important is it that the Government of Canada invests in green transportation initiatives?
Communications issues
You’re almost finished this survey. Thank you for sharing your views.
43. If you wanted information on transportation, where would you look? This could include information on transportation policies, programs, and safety regulations across air, rail, water, and road systems in the country.
Select all that apply
[RANDOMIZE LIST]
44. Who would you trust the most to provide information about Canada’s transportation system? This could include information on transportation policies, programs, and safety regulations across the air, rail, water, and road systems in the country.
[RANDOMIZE LIST]
45. Which of the following sources do you rely on most often for information or news? news or information?
Select all that apply
[RANDOMIZE LIST]
46. Thinking about Canada’s transportation system, what, if anything, would you like to know more about?
Select all that apply
[RANDOMIZE LIST]
Demographics
These last few questions are for background purposes. All responses will remain confidential.
47. What is the highest level of formal education that you have completed?
48. Which of the following best describes your total household income last year, before taxes, from all sources for all household members?
49. What language do you speak most often at home?
Select all that apply
50. What are the first three characters of your postal code?
Closing page
That concludes the survey. This survey was conducted on behalf of Transport Canada. In the coming months, a report with the findings from this study will be available to the public on the Library and Archives Canada website (Library and Archives Canada/). Thank you very much for taking part. Your participation is appreciated.
Introduction
Hello/Bonjour, my name is [INSERT]. I’m calling from Phoenix Strategic Perspectives, a Canadian public opinion research firm. Would you prefer to continue in English or French? / Préférez-vous continuer en français ou en anglais?
Intro1. Language:
[RECRUITER NOTE: FOR ENGLISH GROUPS, IF THE INDIVIDUAL WOULD PREFER TO CONTINUE IN FRENCH, PLEASE CONTINUE IN FRENCH AND RECRUIT FOR THE FRENCH GROUP. FOR THE FRENCH GROUP, IF THE INDIVIDUAL WOULD PREFER TO CONTINUE IN ENGLISH, PLEASE CONTINUE IN ENGLISH. CONFIRM THAT THE SESSION TIME IS ACCEPTABLE AND THEN RECRUIT FOR AN OPEN ENGLISH GROUP.
Intro2. We are organizing a series of discussion groups on issues of importance to Canadians on behalf of the Government of Canada. We are looking for people aged 18 and older who would be willing to participate in an online discussion group. Are you at least 18 years of age?
Information
The online focus groups are being conducted on behalf of the Government of Canada to collect input from [Canadians / Indigenous Peoples] on Canada’s transportation system. Participation is completely voluntary and your decision to participate or not will not affect any dealings you may have with the Government of Canada. We are interested in hearing your opinions; no attempt will be made to sell you anything or change your point of view. Those who participate will receive a cash gift to thank them for their time.
May I continue?
Thank you. The format is an online discussion with up to 8 participants led by a research professional from Phoenix Strategic Perspectives. All opinions will remain anonymous, and views will be grouped together to ensure that no individual can be identified. The information collected as part of this focus group will be used for research purposes only and handled according to the Privacy Act of Canada. In addition to protecting your personal information, the Privacy Act gives you the right to request access to and correction of your personal information. You also have the right to file a complaint with the Privacy Commissioner of Canada if you think your personal information has been handled improperly. If you wish to confirm the validity of this study, I can provide you a project identification number.**
Recruiter notes:
EN: https://www.canadianresearchinsightscouncil.ca/rvs/home/
FR: https://www.canadianresearchinsightscouncil.ca/rvs/home/?lang=fr
Questions
The focus group will take place online on February [INSERT DATE] at [TIME] and will last up to an hour and a half.
1. Would you be interested in taking part in this study?
2. Before we invite you to attend, I need to ask you a few questions to ensure that we get a good mix of participants. This will take 5 minutes. May I continue?
3. Are you First Nations, Métis, or Inuk (Inuit)?
4. The focus groups are going to be online sessions held over the internet. Participants will need to have access to a computer, a high-speed internet connection, and a Webcam to participate in the group. The Webcam will need to be turned on for the duration of the session. Would you be able to participate under these conditions?
5. We’ve been asked to speak to participants of all different ages. May I have your age please? [AIM FOR A MIX FOR EACH GROUP]
6. In which province or territory do you live? This information is needed to make sure you are assigned to a focus group that takes place in your time zone. [DO NOT READ LIST]
7. Which gender do you identify as? [RECRUIT A MIX IN EACH GROUP]
8. What is the highest level of formal education that you have completed? [RECRUIT A MIX IN EACH GROUP]
9. Which of the following best describes your total household income last year, before taxes, from all sources for all household members? [READ LIST; STOP READING WHEN A CATEGORY IS SELECTED. RECRUIT A MIX IN EACH GROUP]
10. [ASK IF Q3=02-04] Do you live on a reserve?
Industry screening and consent
11. Have you ever attended a discussion group or taken part in an interview on any topic that was arranged in advance and for which you received money for your participation?
12. [IF Q11=01] When did you last attend one of these discussion groups or interviews?
13. Thinking about the groups or interviews that you have taken part in, what were the main topics discussed?
RECORD: _______________ [TERMINATE IF RELATED TO TRANSPORTATION]
14. How many discussion groups have you attended in the past 5 years?
15. The discussion group will be recorded. The recordings will be used only by the research professional to assist in preparing a report on the findings and they will be destroyed once the report is final. Do you agree to be recorded for research purposes only?
16. [IF Q15=02 OR 03] It is necessary for the analysis process for us to record the session as the moderator needs this material to complete the report. The recordings will be used only by the research firm to assist with writing the report and will not be shared. Now that I’ve explained this, do you agree to be recorded for research purposes?
17. There may be some people from the Government of Canada observing the groups. They will not take part in the discussion. They will be attending to hear your opinions firsthand although they may take their own notes and confer with the moderator to discuss additional questions to ask the group. Do you agree to be observed by employees of the Government of Canada?
18. We will provide thefocus group moderator with a list of participants’ names so that they can sign you into the group. We will provide your first name and the first letter of your last name as well as your responses to this questionnaire. Do we have your permission to do this? I assure you it will be kept strictly confidential.
19. [IF Q18=02 OR 03] We need to provide the focus group moderator with the names of the people attending the focus group because only the individuals invited are allowed in the session and the moderator must have this information for verification purposes. Only your first name will be visible when you join the focus group session. Now that I’ve explained this, do I have your permission to provide your name and profile to the moderator?
Invitation to participate
You qualify to participate in one of our virtual discussion groups. The discussion will be led by a researcher from the public opinion research firm, Phoenix Strategic Perspectives. The group will take place on [DAY OF WEEK], [DATE], at [TIME], and will last an hour and a half [1.5 hours]. If you participate, you will receive an honorarium of $125 for your time.
20. Are you willing to attend?
21. May I have your email address so that we can also send you an email message with the information you will need about the focus group?
ENTER EMAIL ADDRESS: ____________________
Information regarding how to participate will be sent to you by email in the coming days. You will be asked to log into the online session 10 minutes prior to the start time. If you do not log in on time, you may not be able to participate and you will not receive an honorarium.
As we are only inviting a small number of people to attend, your participation is very important to us. If for some reason you are unable to attend, please call us so that we can get someone to replace you. You can reach us at [INSERT NUMBER] at our office. Please ask for [INSERT NAME].
Someone will call you the day before to remind you about the session. Will you please confirm your name and contact information for me?
First name: __________________________
Last Name: __________________________
Phone number: ______________________
Thank you very much for your time and willingness to participate in this research.
Introduction 5 minutes
→ Introduce moderator/firm and welcome participants to the focus group.
TECHNICAL CHECK; CONFIRM SOUND AND VIDEO QUALITY.
→ Describe focus group.
→ Explanations.
→ Any questions?
→ Roundtable introduction: Let’s start with everyone introducing themselves, first name only, please, and letting us know which province or territory you are from.
General Perceptions and Knowledge 20 minutes
Green Transportation 15 minutes
Safety 10 minutes
Supply Chains 15 minutes
Now let’s talk about supply chains.
A supply chain is the journey a product or service takes from start to finish…so from getting the raw materials to delivering the final product or service to the consumer. Along this journey, people, businesses and processes work together to make, transport and deliver the final product or service as efficiently as possible.
Indigenous Peoples 10 minutes
Communications 10 minutes
The last topic I’d like to cover tonight is communications.
Conclusion 5 minutes
We’ve covered a lot tonight and I really appreciate you taking the time to share your opinions. Does anyone have any last thoughts or feedback to share with Transport Canada about the topic?
On behalf of the Government of Canada, I would like to thank you for your time and participation today. The honorarium will be available through the recruiter.
You can all log out now. Have a great evening!