Final report
Prepared for Natural Resources Canada
Supplier Name: Phoenix SPI
Contract Number: CW2378697
Award Date: 2024-11-12
Contract Value: $75,400.38 (including applicable taxes)
Delivery Date: 2025-03-21
Registration Number: POR # 065-24
For more information, please contact: nrcan.por-rop.rncan@canada.ca
Ce rapport est aussi disponible en français.
2025 Greening Freight Programs Industry Survey
Final Report
Prepared for Natural Resources Canada
Supplier name: Phoenix Strategic Perspectives Inc.
March 2025
This public opinion research report presents the results of a 16-minute telephone survey of 301 representatives of the Canadian freight transportation industry who were involved in or knowledgeable about the management or implementation of trucking fuel efficiency programs and policies within the business’ fleet of vehicles. The fieldwork was conducted from January 14 to February 7, 2025.
Permission to Reproduce
The information in this publication may be reproduced, in part or in whole and by any means, without charge or further permission from Natural Resources Canada, provided that due diligence is exercised in ensuring the accuracy of the information reproduced; that Natural Resources Canada is identified as the source institution; and that the reproduction is not represented as an official version of the information reproduced or as having been made in affiliation with, or with the endorsement of Natural Resources Canada. For more information on this report, please contact Natural Resources Canada at: nrcan.por-rop.rncan@canada.ca.
Catalogue number:
M144-294/2025E-PDF
International Standard Book Number (ISBN):
ISBN 978-0-660-75905-0
Cette publication est aussi disponible en français sous le titre : Sondage de 2025 sur les programmes de transport écoénergétique de marchandises mené auprès de l’industrie.
Related Publication (Registration Number: POR #065-24):
Catalogue number: M144-294/2025F-PDF
ISBN: 978-0-660-75906-7
© His Majesty the King in Right of Canada, as represented by the Minister of Natural Resources, 2025.
Phoenix Strategic Perspectives (Phoenix SPI) was commissioned by the department of Natural Resources Canada (NRCan) to conduct survey research with Canadian freight industry representatives to assess awareness and uptake of fleet energy assessments, truck and trailer retrofits and engine repowers, as well as awareness and participation in green freight programs.
The Greening Freight Programs (SmartWay, SmartDriver, and the Green Freight Program) are three programs administered by NRCan that provide training, tools, and resources to help Canada’s fleets lower their fuel consumption, operating costs, and harmful vehicle emissions. Specifically:
The purpose of the research was to assess perspectives on reducing fuel use and improving energy efficiency in freight transportation among the industry. The Department has previously conducted surveys on this topic in Fall 2018, Winter 2022, Fall 2022/Winter 2023, and Fall 2023/Winter2024.
The results of this study will help inform future public policy to help Canadian fleets lower their fuel consumption, operating costs and vehicle emissions.
A 16-minute telephone survey was conducted with a random sampling of 301 representatives of the Canadian freight transportation industry who occupy a position of owner/operator or senior level manager.
The sampling frame was purchased from Dun & Bradstreet (D&B Canada) and drawn from NAICS code 4841 (General Freight Trucking)—specifically: 48411 (Local) and 48412 (Long Distance) and NAICS code 4842 (Specialized Freight [except Used Goods] Trucking Local—specifically: 484220 (Local) and 484230 (Long Distance).
All respondents were involved in, or knowledgeable about, the management or implementation of trucking fuel efficiency programs and policies within the business’ fleet of vehicles. Forty-four percent (44%) of respondents described themselves as very knowledgeable in this regard and 56% as somewhat knowledge.
The results were weighted to reflect the actual distribution of businesses operating in this sector in Canada and can be considered accurate to within ±6%, 19 times out of 20. The margins of error are greater for results pertaining to subgroups and smaller samples within the total survey sample.
The fieldwork was conducted from January 14 to February 7, 2025. More information on the methodology can be found in the Appendix: Technical Specifications.
Company and Fleet Profile
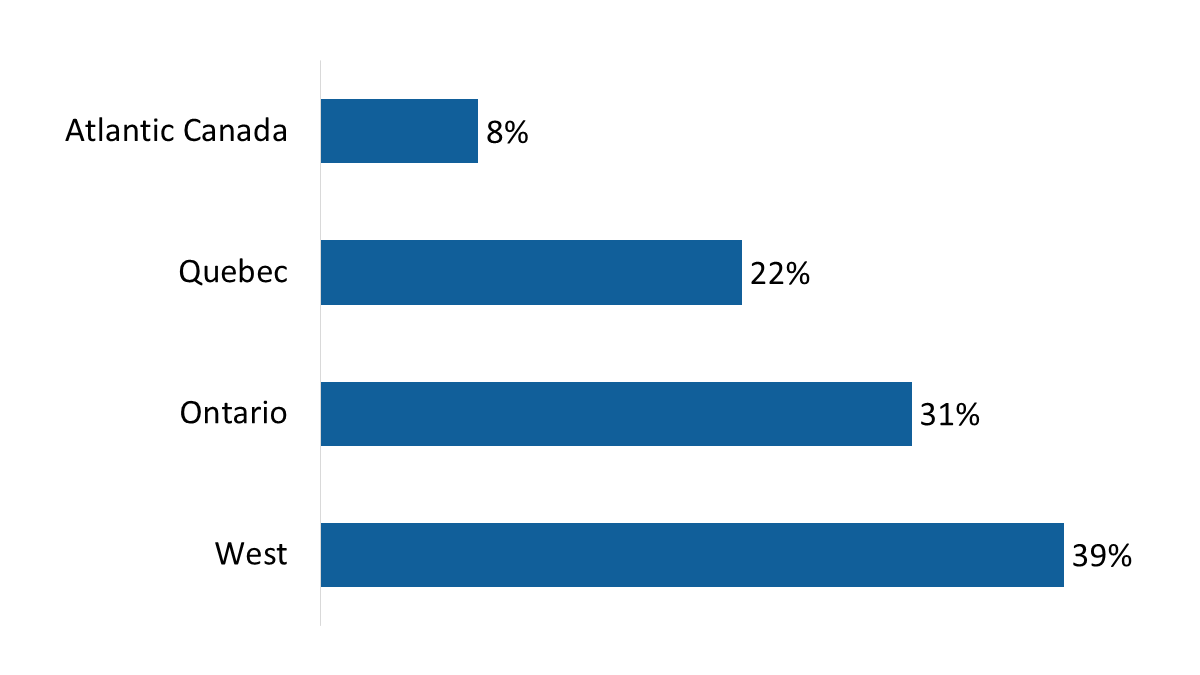
A total of 301 representatives of freight transportation companies participated in this survey, with companies distributed regionally as follows: 8% have their head office in Atlantic Canada, 22% in Quebec, 31% in Ontario, and 39% in the West.Footnote 1 Most companies have fewer than 100 employees: 32% have up to 4 employees, 10% 5 to 9 employees, and 36% 10 to 49 employees. Twelve percent of companies have 50 or more employees.
The type of fleet reported by companies varies, with 37% exclusively operating for-hire fleets and 38% exclusively operating private fleets. Among the rest, almost one-quarter (23%) operate both for-hire and private fleets. In terms of ownership, 63% of companies exclusively own the trucks in their fleet, while 5% exclusively lease. The rest (32%) have trucks in their fleets that are both owned and leased. The median number of trucks in the fleets of responding companies was 10 trucks, and approximately four in 10 companies (42%) have between one and nine trucks that are less than five years of age.
More companies use their trucks for short (62%) or long (63%) hauls than for regional hauls (55%). Ninety-seven percent of companies operate trucks powered by diesel, with the top three types of trucks being dry vans (42%), flatbeds (24%), and specialized (20%).
Government Funding Programs
The majority of freight industry representatives surveyed believe government funding programs that support fleet retrofits are important, with 25% saying they are somewhat important and 32% very important. Familiarity with federal green transportation programs is growing, with a little over two-thirds (68%) of respondents saying they are familiar with at least one program (compared to 57% in 2024). Approximately two in 10 companies participate in a green transportation program, such as the SmartWay Transport Partnership program (7%), the Green Freight Program: Stream 1 ‘Assess and Retrofit’ (5%), and Quebec’s Programme Écocamionnage (3%).
Fleet Energy Assessments
One in 10 (11%) companies have had a third party conduct an energy assessment of their fleet. Among companies that have not had an energy assessment, two in 10 (20%) attributed this to lack of awareness. Other reasons for not considering a fleet energy assessment related to lack of need, lack of value, and cost.
Retrofits
Approximately one-quarter (24%) of surveyed companies have implemented truck retrofits in the past year. Among those that completed retrofits, 65% installed cab heaters, while just over four in 10 adopted telematics (46%), route optimization technology (44%), cab coolers (42%), and low rolling resistance tires (42%). Cost remains the primary barrier to retrofitting, with over half (59%) of respondents citing it as a challenge—an increase from 39% in 2024 and 29% in 2023.
Refuelling/Charging Infrastructure
When asked how their company charges or refuels its fleet, 37% of respondents reported using on-site fuel tanks, while 34% cited public CNG stations. Only 8% utilize on-site charging stations, and 2% recharge at dealerships (e.g., for hydrogen). Additionally, 10% of freight representatives indicated that their company is considering installing charging or refueling infrastructure for zero-emission trucks at their depot. Cost and perceived lack of need were the primary reasons for not pursuing this infrastructure.
Fuel Efficiency Measures
The vast majority (91%) of companies monitor at least some aspects of their fleet’s fuel efficiency. The most commonly tracked metrics include total kilometers travelled (91%), fuel consumption (85%), driving habits (71%), average speed (67%), and idle time (64%). To track these efficiency metrics, half (50%) of the companies use electronic logging devices, while 26% rely on telematics devices and 24% use manual calculations.
Statement of political neutrality
I hereby certify as a Senior Officer of Phoenix Strategic Perspectives that the deliverables fully comply with the Government of Canada political neutrality requirements outlined in the Communications Policy of the Government of Canada and Procedures for Planning and Contracting Public Opinion Research. Specifically, the deliverables do not contain any reference to electoral voting intentions, political party preferences, standings with the electorate, or ratings of the performance of a political party or its leader.
(original signed by)
Alethea Woods
President
Phoenix Strategic Perspectives Inc.
This section provides a profile of the companies represented in the survey. Information about these companies’ fleets can be found in Section 2: Fleet Profile.
Freight transportation companies were sampled proportionally by region, with the majority reporting head offices in western Canada (39%) or Ontario (31%).
| Atlantic Canada | 8% |
| Quebec | 22% |
| Ontario | 31% |
| West | 39% |
Q4. In which province or territory is your company’s head office located? Base: n=301; All respondents.
The majority of survey respondents represent small companies, with 78% employing fewer than 100 employees. Specifically, 32% have up to four employees, 10% five to nine employees, and 36% 10 to 49 employees. Nine percent of companies are medium in size, employing 100 to 499 employees and the rest (3%) are large, with 500 or more employees.
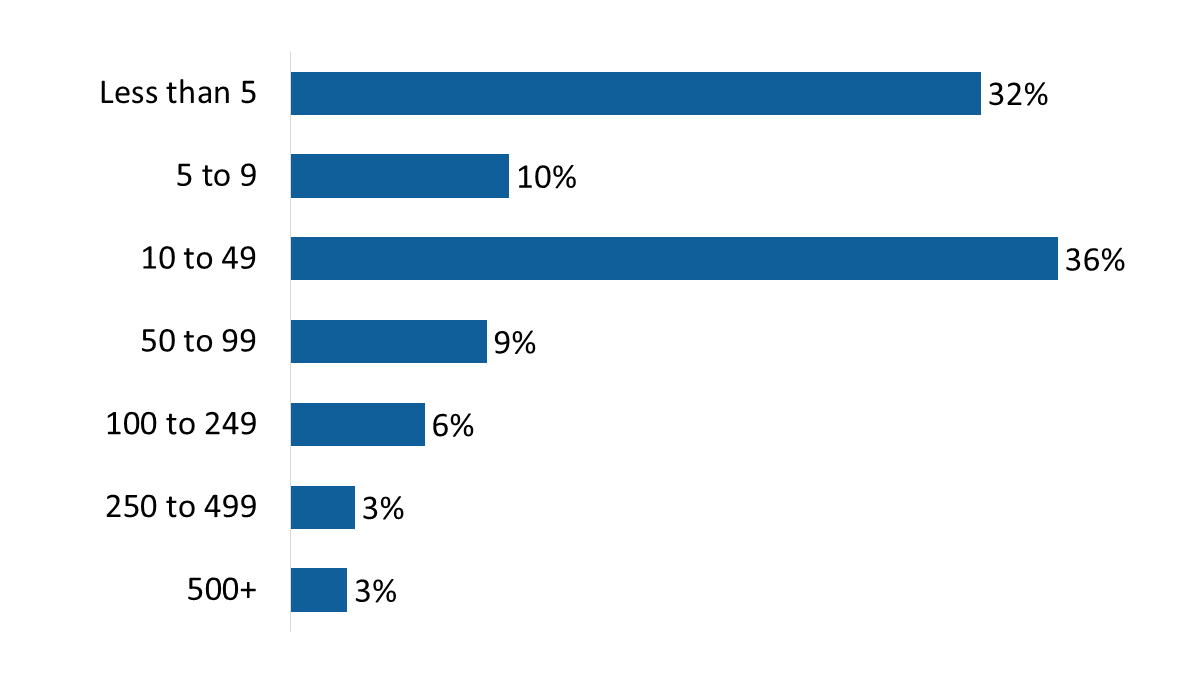
| Less than 5 | 32% |
| 5 to 9 | 10% |
| 10 to 49 | 36% |
| 50 to 99 | 9% |
| 100 to 249 | 6% |
| 250 to 499 | 3% |
| 500+ | 3% |
Q5. How many employees work for your company? Base: n=301; All respondents.
Approximately nine in 10 (92%) companies employ fewer than 100 drivers. Specifically, 35% employ 10 to 49 drivers, 12% five to nine, and 40% up to four drivers. Only 5% of companies employ 100 or more drivers. The median number of drivers employed by the responding companies is eight drivers.
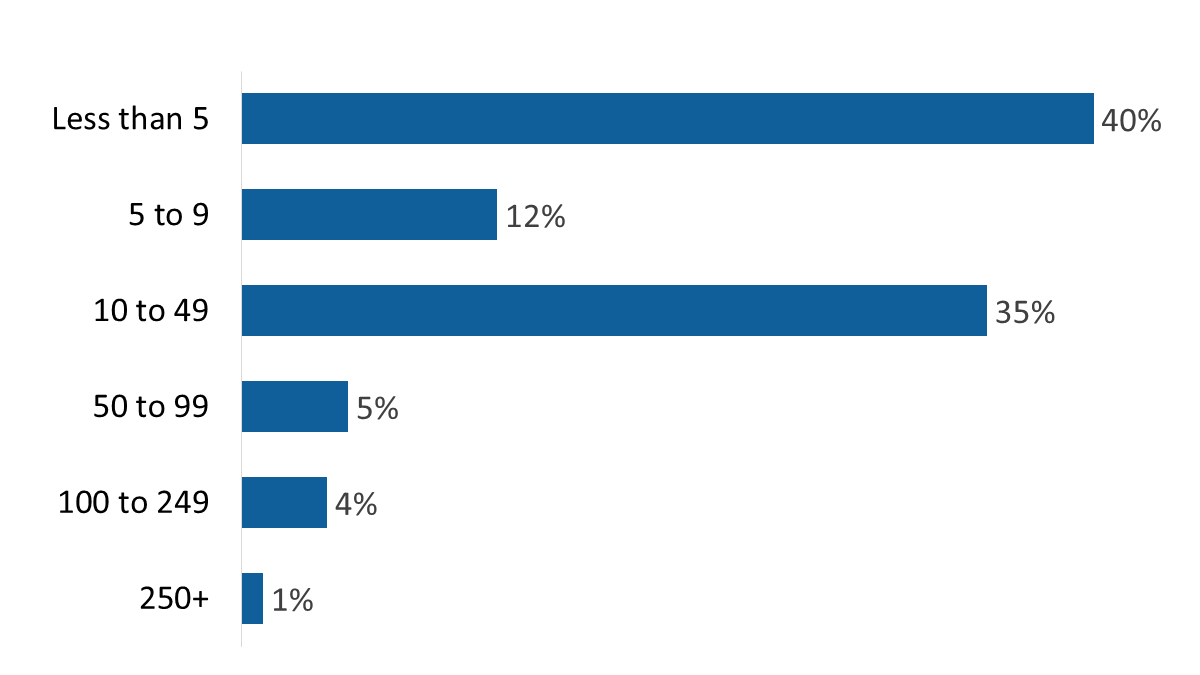
| Less than 5 | 40% |
| 5 to 9 | 12% |
| 10 to 49 | 35% |
| 50 to 99 | 5% |
| 100 to 249 | 4% |
| 250+ | 1% |
Q6. How many of these employees are employed as drivers for your company? Base: n=301; all respondents. [No response: 2%]
This section of the report presents a profile of the truck fleets of responding companies.
The type of fleet reported by companies continues to be varied, with 37% exclusively operating for- hire fleets and 38% exclusively operating private fleets. Among the rest, almost one-quarter (23%) operate both for-hire and private fleets. Year-over-year changes are not significant.
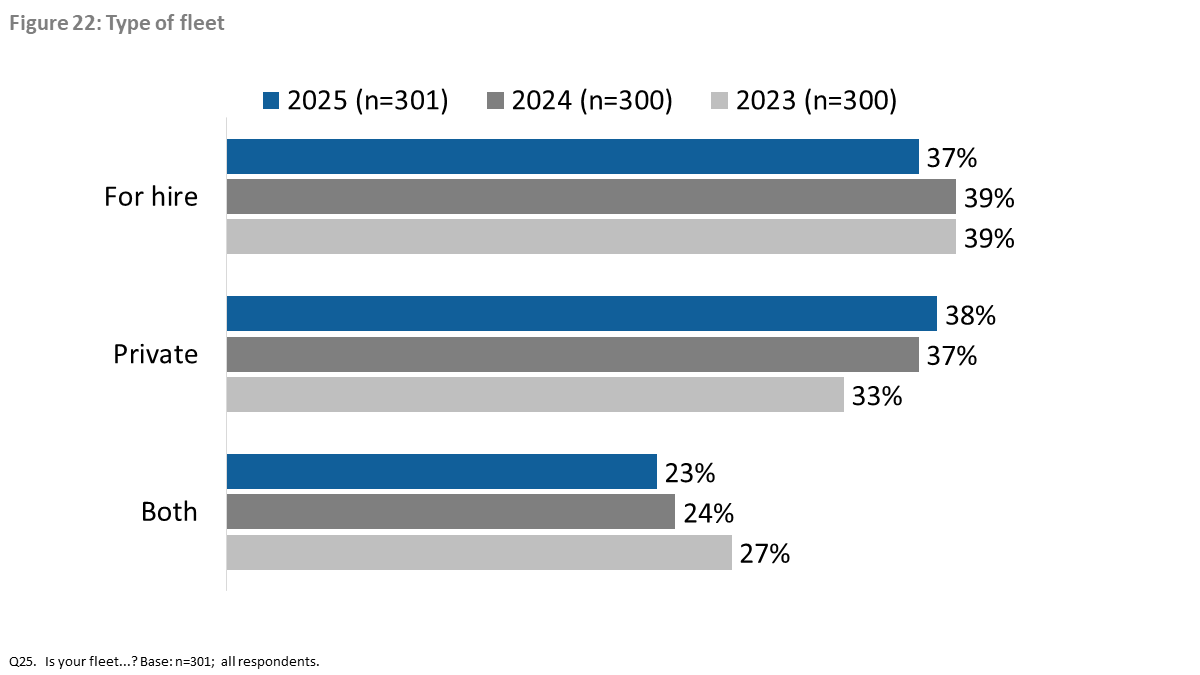
| 2025 (n=301) | 2024 (n=300) | 2023 (n=300) | |
| For hire | 37% | 39% | 39% |
| Private | 38% | 37% | 33% |
| Both | 23% | 24% | 27% |
| Don’t know | 2% | 1% | 2% |
Q25. Is your fleet...Base: all respondents. [Don’t know: 2%].
Consistent with 2024, companies based in Quebec (80%) are the most likely to operate a private fleet. This finding is based on responses to Question 25 (Type of Fleet), analyzed by responses to Question 4 (Company Headquarters).
Almost two-thirds (63%) of surveyed companies exclusively own the trucks in their fleet, while 5% exclusively lease. The rest (32%) have trucks in their fleets that are both owned and leased.
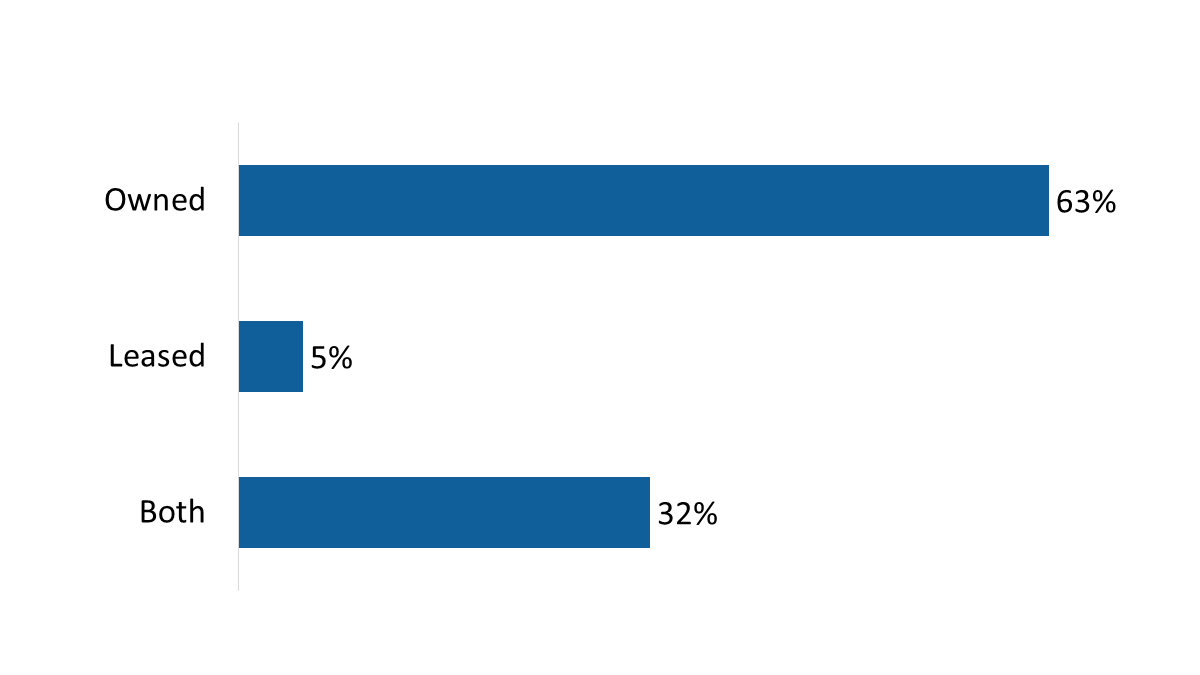
| Owned | 63% |
| Leased | 5% |
| Both | 32% |
Q26. Are the trucks in your fleet…? Base: n=301; all respondents.
Companies with fewer than five employees (76%) are more likely than larger companies to own the trucks in their fleet (60% of companies with 5 to 99 employees and 46% of companies with 100+ employees). This finding is based on responses to Question 26, analyzed by responses to Question 5 (Company size, based on number of employees).
Almost half of companies operate fleets of fewer than 10 trucks—specifically, 33% have one to four trucks and 18% have five to nine trucks. Over one-third (38%) have 10 to 49 trucks in their company fleet, while the rest (14%) have 50 or more trucks. The median number of trucks in the fleets of responding companies was 10. Fleet size has changed very little since 2023.
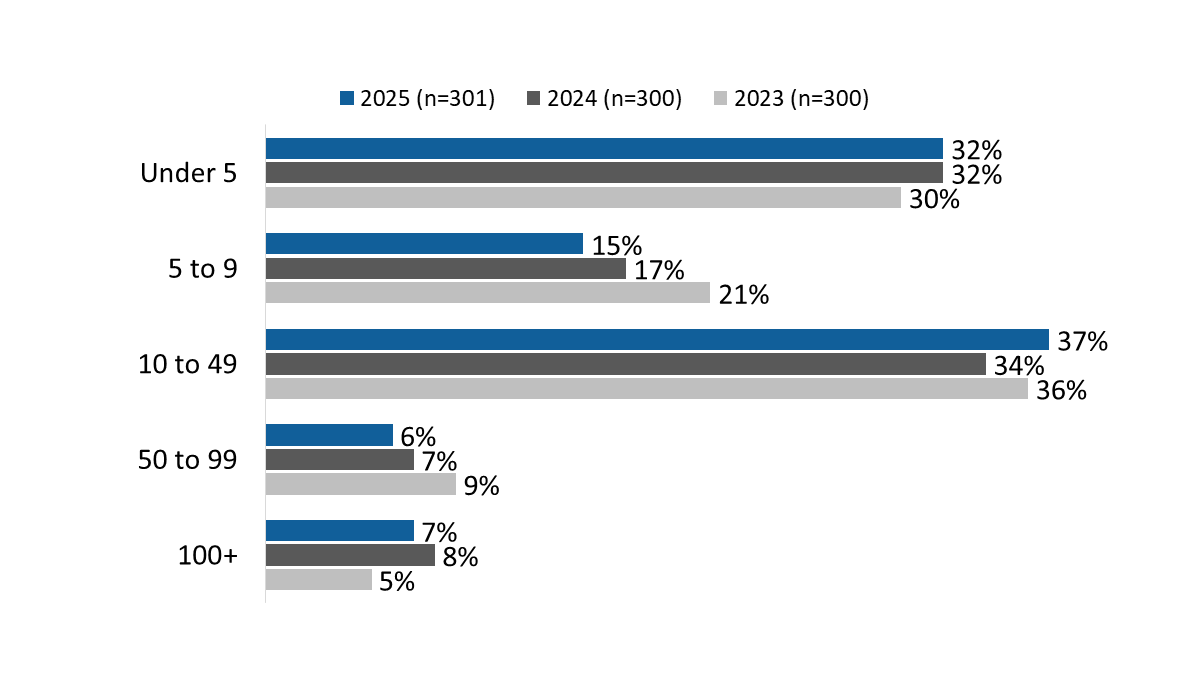
| 2025 (n=301) | 2024 (n=300) | 2023 (n=300) | |
| Under 5 | 32% | 32% | 30% |
| 5 to 9 | 15% | 17% | 21% |
| 10 to 49 | 37% | 34% | 36% |
| 50 to 99 | 6% | 7% | 9% |
| 100+ | 7% | 8% | 5% |
Q27. How many trucks are in your company's fleet? Base: all respondents. [Don’t know: 2%].
The number of trucks in a company’s fleet generally corresponds to company size—for example, companies with fewer than five trucks are more likely to have no more than five employees. This finding is based on responses to Question 27, analyzed by responses to Question 5 (Company size).
Eighteen percent of companies surveyed have no trucks in their fleet that are less than five years old. Four in 10 have between one and four (29%) or five and nine (13%) trucks that are less than five years old. The rest of the companies surveyed have at least 10 trucks in their fleet that are less than five years old.
Among the surveyed companies:
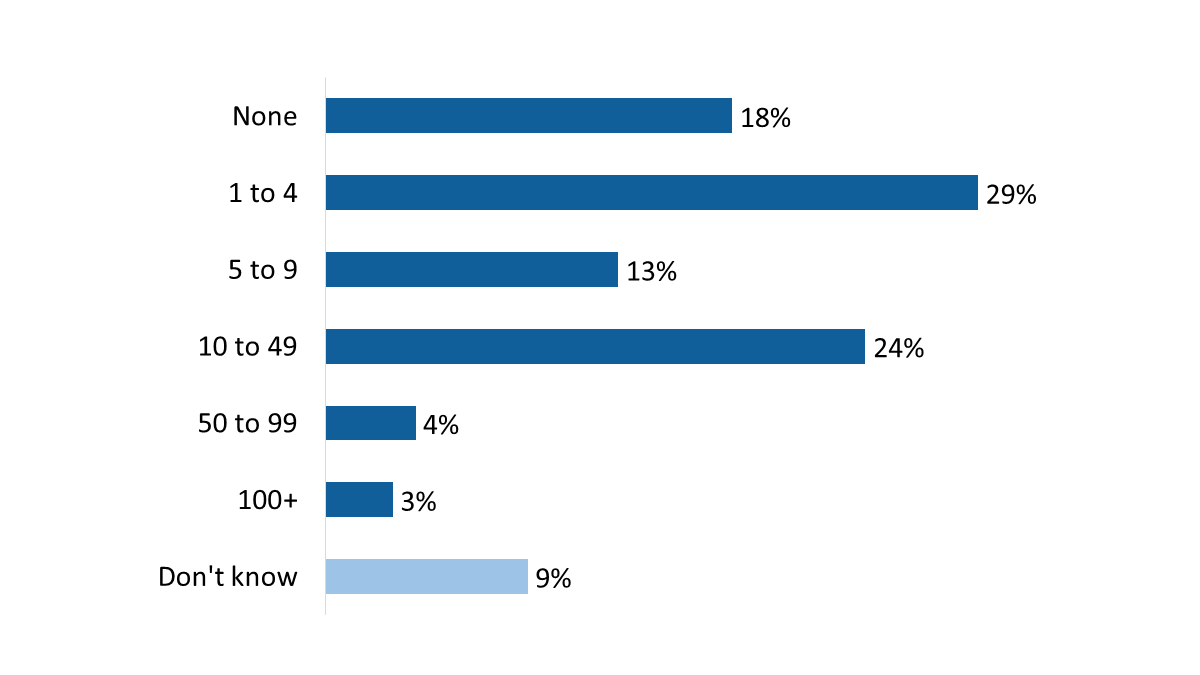
| None | 18% |
| 1 to 4 | 29% |
| 5 to 9 | 13% |
| 10 to 49 | 24% |
| 50 to 99 | 4% |
| 100+ | 3% |
| Don't know | 9% |
Q31. How many trucks in your fleet are less than five years old? Base: n=301; all respondents.
Companies with fewer than five employees are more likely than companies with five or more employees to have no trucks in their fleet that are less than five years old. This finding is based on responses to Question 31, analyzed by responses to Question 5 (Company size).
Four in 10 (42%) freight transportation companies surveyed have dry vans in their fleet, while 24% have flatbeds, and 20% have specialized trucks. All other types of trucks were mentioned by smaller numbers and can be found listed below in figure 8.
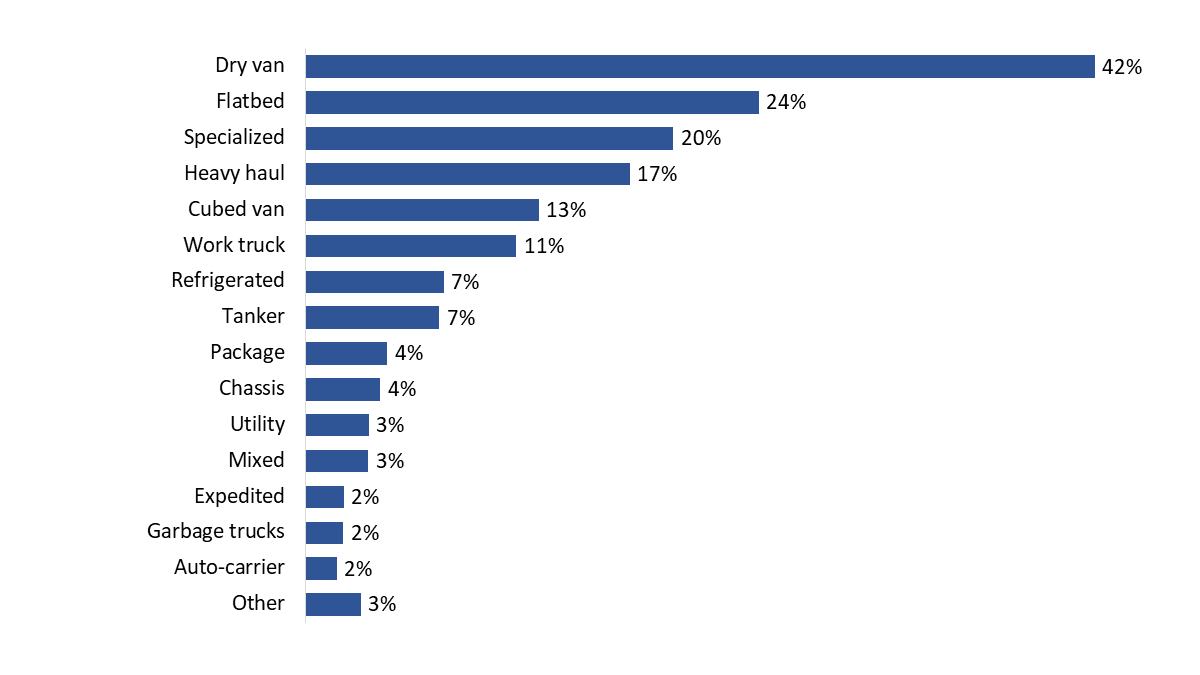
| Dry van | 42% |
| Flatbed | 24% |
| Specialized | 20% |
| Heavy haul | 17% |
| Cubed van | 13% |
| Work truck | 11% |
| Refrigerated | 7% |
| Tanker | 7% |
| Package | 4% |
| Chassis | 4% |
| Utility | 3% |
| Mixed | 3% |
| Expedited | 2% |
| Garbage trucks | 2% |
| Auto-carrier | 2% |
| Other | 3% |
Q32. What type of trucks are in your company’s fleet? [Multiple responses accepted] Base: n=301; All respondents.
Companies with 100 or more employees are more likely than companies with 99 or fewer employees to have dry vans and heavy haul trucks. This finding is based on responses to Question 32, analyzed by responses to Question 5 (Company size).
Compared to 2024, the top four types of trucks in the fleets of surveyed companies remain the same: dry van, flatbed, specialized and heavy haul.
| Type of Trucks | 2025 (n=301) |
2024 (n=300) |
2023 (n=300) |
|---|---|---|---|
| Dry van | 42% | 49% | 41% |
| Flatbed | 24% | 18% | 22% |
| Specialized | 20% | 17% | 13% |
| Heavy haul | 17% | 14% | 25% |
| Cubed van | 13% | 12% | 13% |
| Work truck | 11% | 6% | 7% |
| Refrigerated | 7% | 13% | 9% |
| Tanker | 7% | 7% | 4% |
| Package | 4% | 1% | 2% |
| Mixed | 3% | 1% | 3% |
| Expedited | 2% | 2% | 3% |
Approximately six in 10 companies surveyed use their trucks for long (63%) and short (62%) hauls, while just over half (55%) reported using them for regional deliveries.
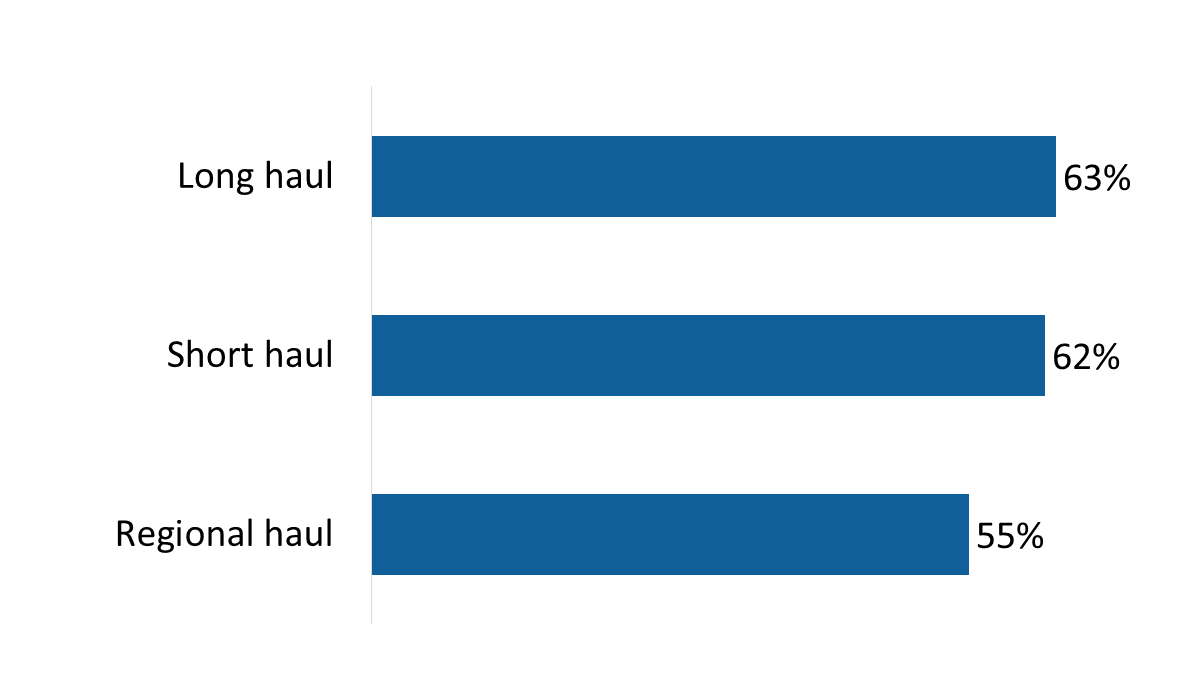
| Long haul | 63% |
| Short haul | 62% |
| Regional haul | 55% |
Q33. Are your trucks used for...? [Multiple responses accepted] Base: n=301; all respondents.
Companies with fewer than five employees are less likely than larger companies to use their trucks for long (51%, compared to 66% of companies with five to 99 employees and 80% with 100+ employees) and regional (38%, compared to 58% and 83%, respectively) hauls. This finding is based on responses to Question 33, analyzed by responses to Question 5 (Company size).
Ninety-seven percent of freight transportation representatives surveyed said that at least one truck in their fleet is powered by diesel. Conversely, 6% of companies power at least one truck in their fleet by an alternative to diesel.
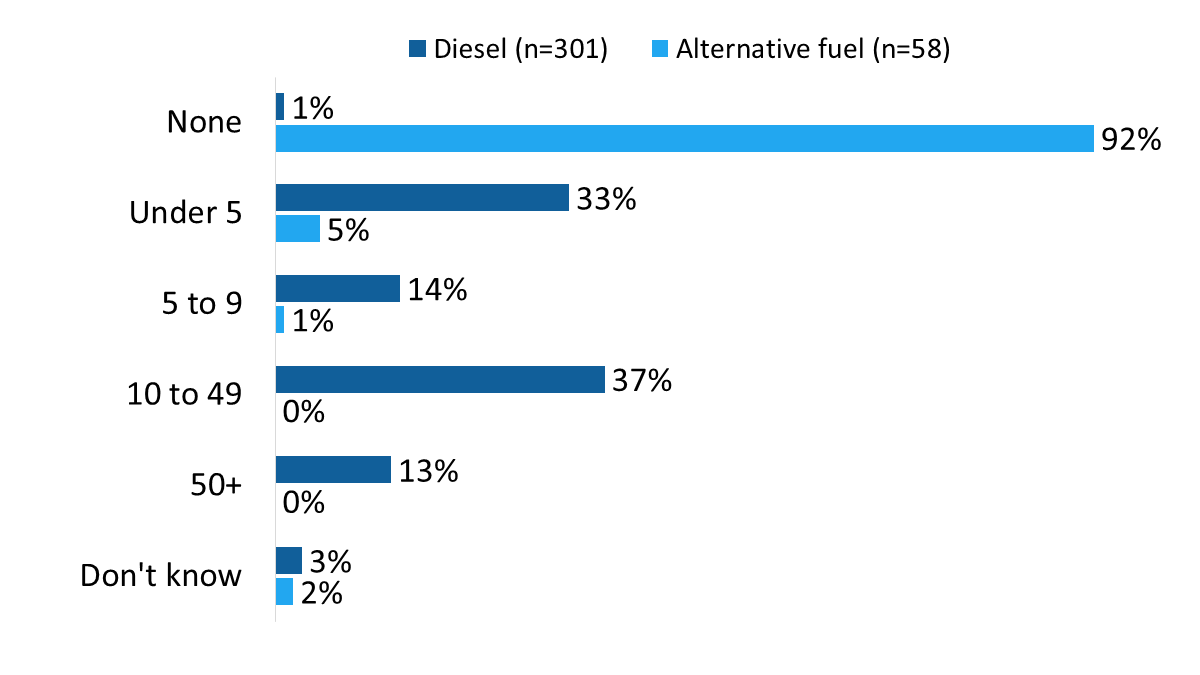
| Diesel (n=301) | Alternative fuel (n=58) | |
| None | 1% | 92% |
| Under 5 | 33% | 5% |
| 5 to 9 | 14% | 1% |
| 10 to 49 | 37% | 0% |
| 50+ | 13% | 0% |
| Don't know | 3% | 2% |
Q28. How many trucks in your company’s fleet are powered by diesel? Base: all respondents.
Q29. How many trucks in your company’s fleet are powered by an alternative fuel to diesel? Base: companies that don’t power all vehicles by diesel.
Among the surveyed companies, 95% reported that between 76% and 100% of their fleet is powered by diesel. Conversely, just 1% of companies using an alternative to diesel power more than 75% of their fleet with alternative fuels.
Many companies that use alternative fuels (n=58) use gasoline (43%) while 15% did not know what type of fuel is used in place of diesel.Footnote 2 Small proportions reported using electricity, compressed natural gas, renewable natural gas, propane, or ethanol.
This section of the report presents respondents’ views of government funding and awareness and use of government green transportation programs.
Almost six in 10 freight transportation representatives said government funding programs that support fleet retrofits are important, with 25% saying somewhat important and 32% very important. Conversely, four in 10 consider government funding programs to be not very (18%) or not at all (21%) important. The perceived importance of government funding programs for fleet retrofits has declined over time, from 68% who said these programs are somewhat or very important in 2023 to 63% in 2024 and further to 57% in 2025.
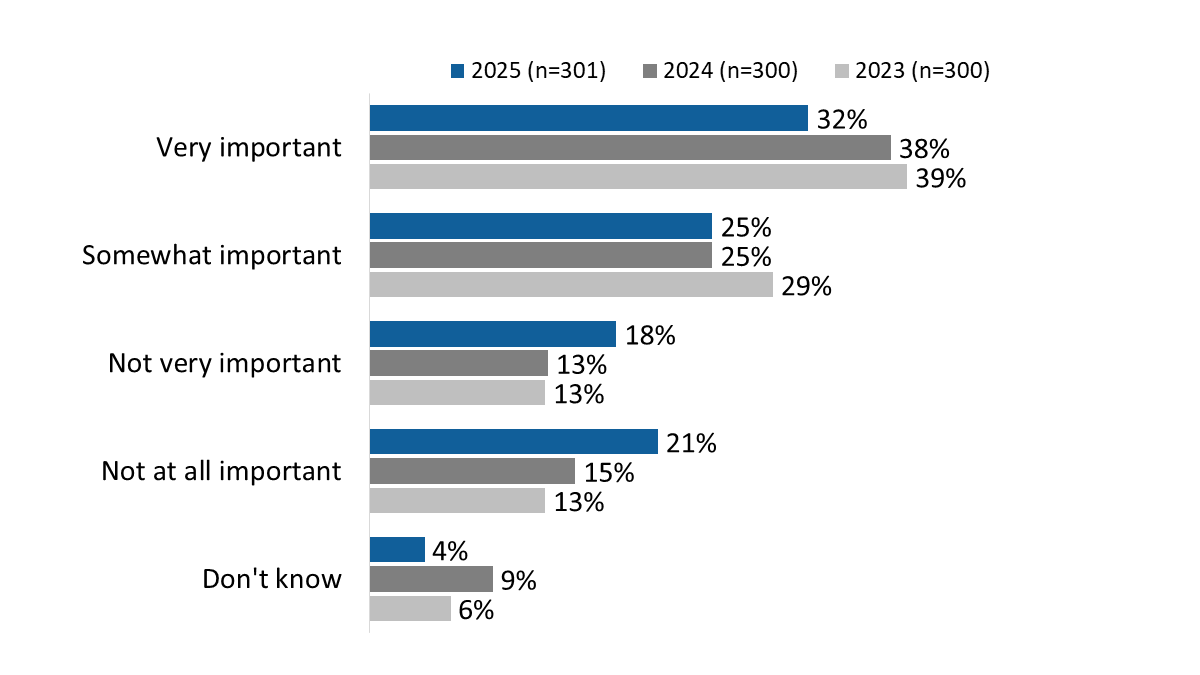
| 2023 (n=300) | 2024 (n=300) | 2025 (n=301) | |
| Don't know | 6% | 9% | 4% |
| Not at all important | 13% | 15% | 21% |
| Not very important | 13% | 13% | 18% |
| Somewhat important | 29% | 25% | 25% |
| Very important | 39% | 38% | 32% |
Q7. In your view, how important, if at all, are government funding programs that support fleet retrofits? Base: All respondents.
Companies with fewer than five employees are less likely than larger companies to attribute importance to government funding programs that support fleet retrofits (45% of companies with fewer than five employees, compared to 61% of companies with five to 99 employees and 69% of companies with 100+ employees). This finding is based on responses to Question 7, analyzed by responses to Question 5 (Company size).
All surveyed freight transportation representatives were asked how familiar they are with the following federal green transportation programs, using a scale of 1 to 5 where ‘1’ is not at all familiar and ‘5’ is very familiar:
Familiarity with specific programs is relatively low, ranging from 10% who are familiar with the ZEVIP to 21% who are familiar with the SmartDriver Training Program. However, when taken together, just over two-thirds (68%) of respondents are familiar with at least one of the six federal green transportation programs.
Overall, familiarity with these programs is growing, from 36% in 2022 to 57% in 2024 and 68% this year.Footnote 3 At the program level, though, the year over year differences are not significant, with the exception of the ZEVAI, where the percentage of freight representatives saying they are familiar with the initiative has declined (21% in 2024 versus 13% in 2025).
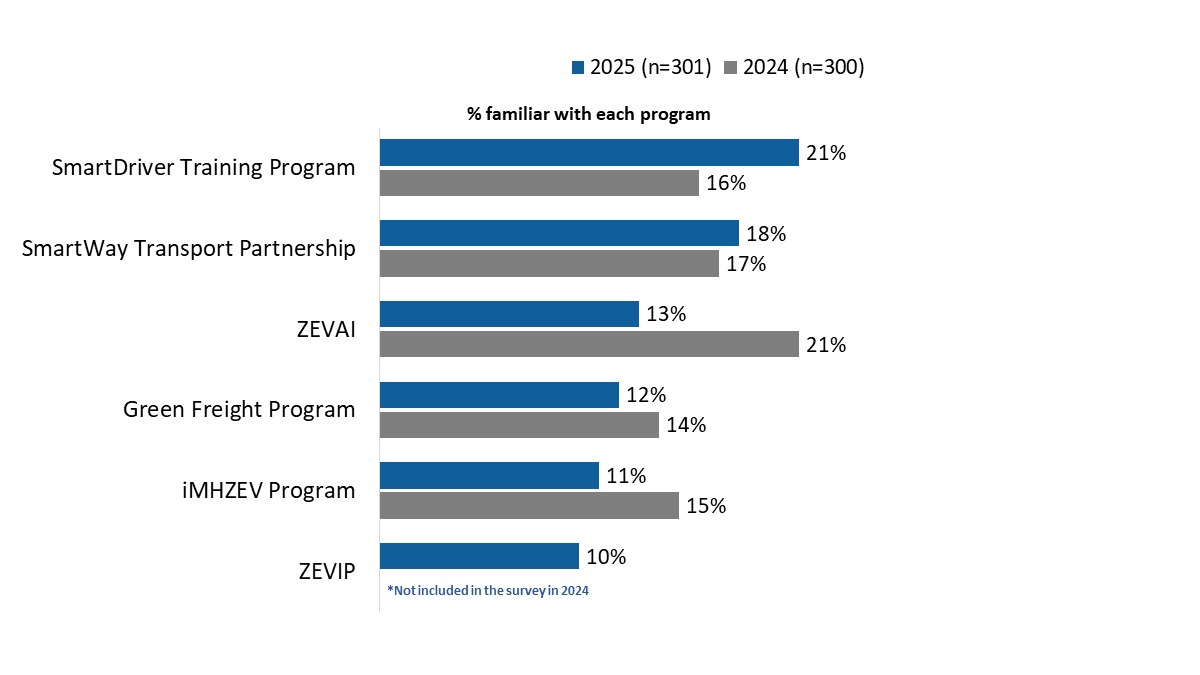
| 2024 (n=300) | 2025 (n=301) | |
| SmartDriver Training Program | 16% | 21% |
| SmartWay Transport Partnership | 17% | 18% |
| ZEVAI | 21% | 13% |
| Green Freight Program | 14% | 12% |
| iMHZEV Program | 15% | 11% |
| ZEVIP | 10% |
Q8. How familiar are you with the following federal green transportation programs? [Multiple responses accepted] Base: n=301; all respondents.
Consistent with 2024, familiarity with at least one of these programs is higher in Quebec (77%) than in the West (59%) and among respondents from larger companies (76% of companies with 50 to 99 employees and 86% of companies with 100+ employees, compared to 56% of companies with fewer than five employees). These findings are based on responses to Question 8, analyzed by responses to Question 4 (Company headquarters) and Question 5 (Company size).
Awareness of provincial and territorial programs for greening freight transportation remains low, similar to federal programs. Eighteen percent of the freight transportation companies surveyed are aware of these programs, while the majority (82%) are not. Awareness of the provincial and territorial rebate programs is unchanged year over year. However, not all provinces and territories have greening freight programs, which may partly explain the low awareness.
Before responding to the question, respondents were reminded that green transportation programs typically focus on things like improving fuel efficiency, reducing greenhouse gas emissions, using cleaner fuels, supporting zero-emission vehicles, and raising awareness or offering incentives to adopt these practices.
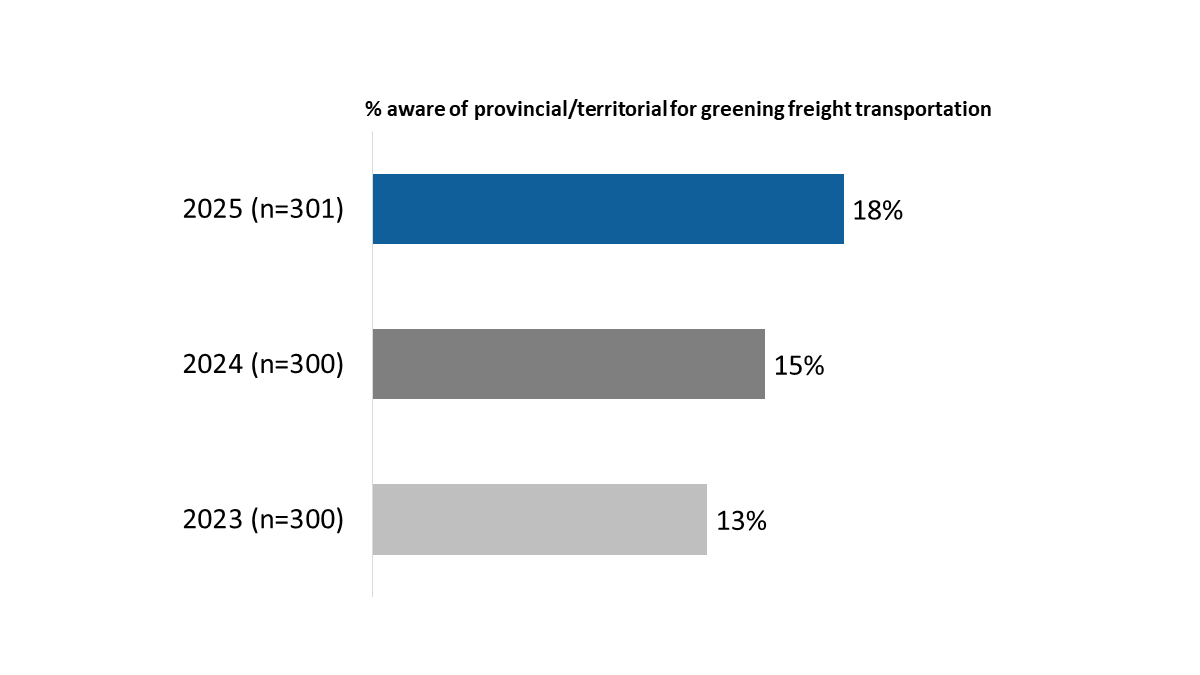
| 2025 (n=301) | 2024 (n=300) | 2023 (n=300) | |
| Aware of provincial/territorial rebate programs for greening freight transportation | 18% | 15% | 13% |
Q9. Are you aware of any [provincial/territorial] programs for greening freight transportation? Base: All respondents.
Respondents from companies headquartered in Atlantic Canada (92%) and Ontario (87%) are more likely to be unaware of these rebate programs compared to their counterparts in Quebec (73%) and western Canada (82%). The only provinces with active green freight programs at the time of the survey were British Columbia and New Brunswick.
Additionally, companies with fewer than 10 employees are more likely than larger companies to be unaware of these programs (90% of companies with five to nine employees and 88% of companies with up to four employees versus 66% of companies that have 100+ employees).
These findings are based on responses to Question 9, analyzed by responses to Question 4 (Company headquarters) and Question 5 (Company size).
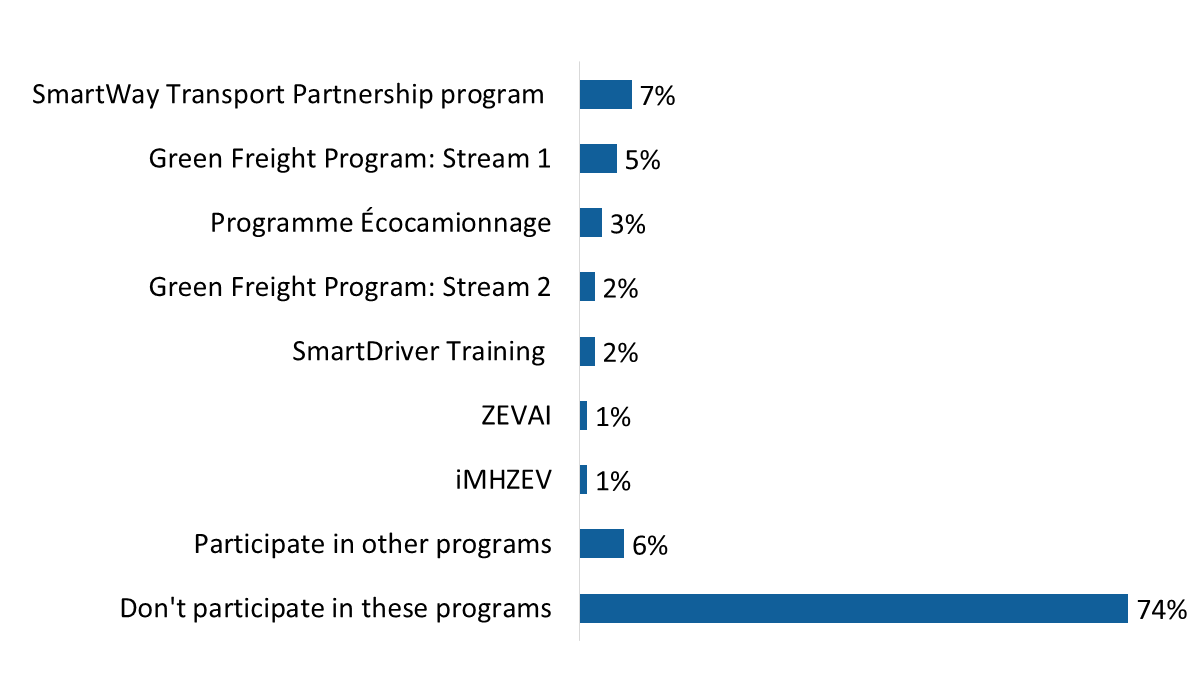
| SmartWay Transport Partnership program | 7% |
| Green Freight Program: Stream 1 | 5% |
| Programme Écocamionnage | 3% |
| Green Freight Program: Stream 2 | 2% |
| SmartDriver Training | 2% |
| ZEVAI | 1% |
| iMHZEV | 1% |
| Participate in other programs | 6% |
| Don't participate in these programs | 74% |
Q10. Which green transportation programs, if any, does your company participate in? [Multiple responses accepted]. Base: n=301; all respondents. [Don’t know: 5%]
Other programs were mentioned by individual respondents and included CleanBC, Manitoba’s Efficient Trucking Program, and BC Trucking Association programs. A few respondents also used this opportunity to mention devices or telematics systems installed in their company’s trucks.
Companies with fewer than 10 employees are less likely to participate in green transportation programs, with non-participation rates at 97% for companies with five to nine employees and 92% for those with up to 4 employees compared to 66% for companies with 10–49 employees. This finding is based on responses to Question 10, analyzed by responses to Question 5 (Company size).
This section of the report discusses fleet energy assessments.
One in 10 (11%) companies have had a third party conduct an energy assessment of their fleet (up from 6% in 2023). Before responding to the question, respondents were informed that an assessment is an analysis of their fleet’s performance that can be used to help their company decide whether to invest in fuel-reducing technologies and upgrade their trucks with energy efficient devices.
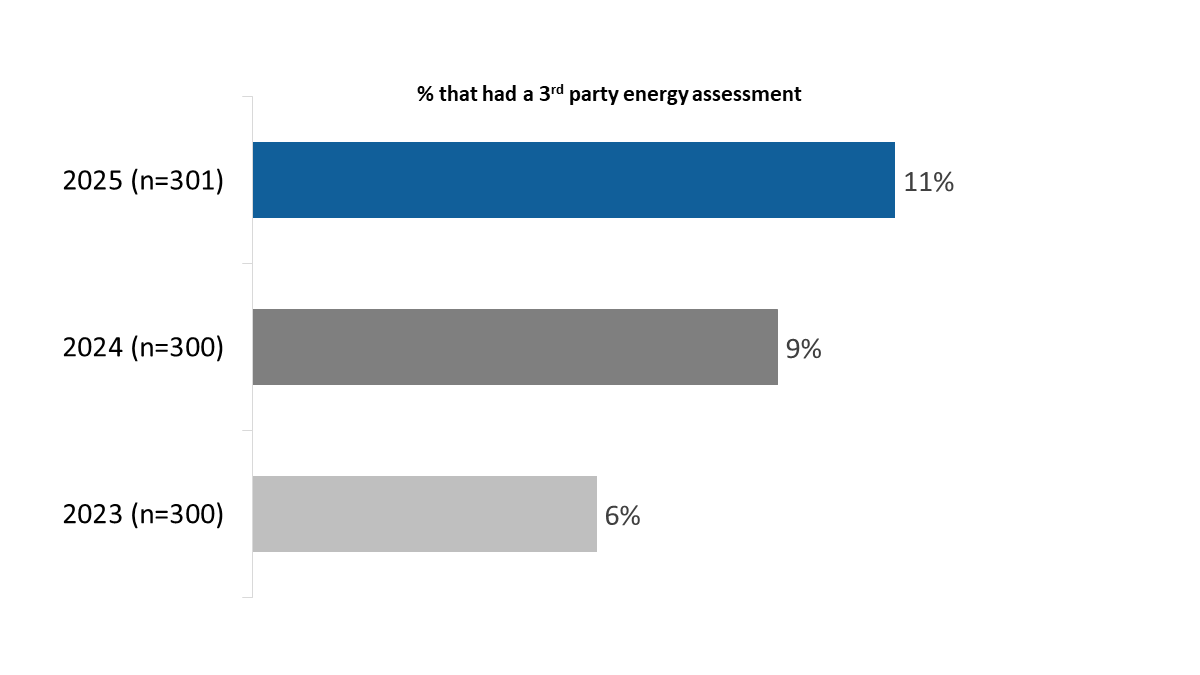
% that had a 3rd party energy assessment |
|
| 2023 (n=300) | 6% |
| 2024 (n=300) | 9% |
| 2025 (n=301) | 11% |
Q15. Has your company ever had a third party conduct an energy assessment of your fleet? Base: all respondents. [Don’t know 2025: 6%]
Companies with fewer than 10 employees are less likely than larger companies to have had an energy assessment. Ninety-seven percent of companies with 5-9 employees and 93% of those with up to 4 employees had not had an assessment, compared to 50% of companies with more than 100 employees. This finding is based on responses to Question 15, analyzed by responses to Question 5 (Company size).
Among companies that have had a third party conduct an energy assessment of their fleet (n=34), most said that the assessment was important when determining retrofits should be made to the company fleet.
Representatives of companies that have not considered a fleet energy assessment (n=267) offered a variety of reasons to explain why. Two in 10 (20%) attributed this to lack of awareness, saying they did not know about energy assessments and the benefits they offer to fleets. Following lack of awareness, the reasons most often mentioned for not considering a fleet energy assessment related to lack of need and lack of value, followed by cost. In 2023 and 2024, lack of need, value and cost were the top reasons companies would never consider having a third party conduct an energy assessment of their fleet.Footnote 5
The full range of responses can be found in figure 17.
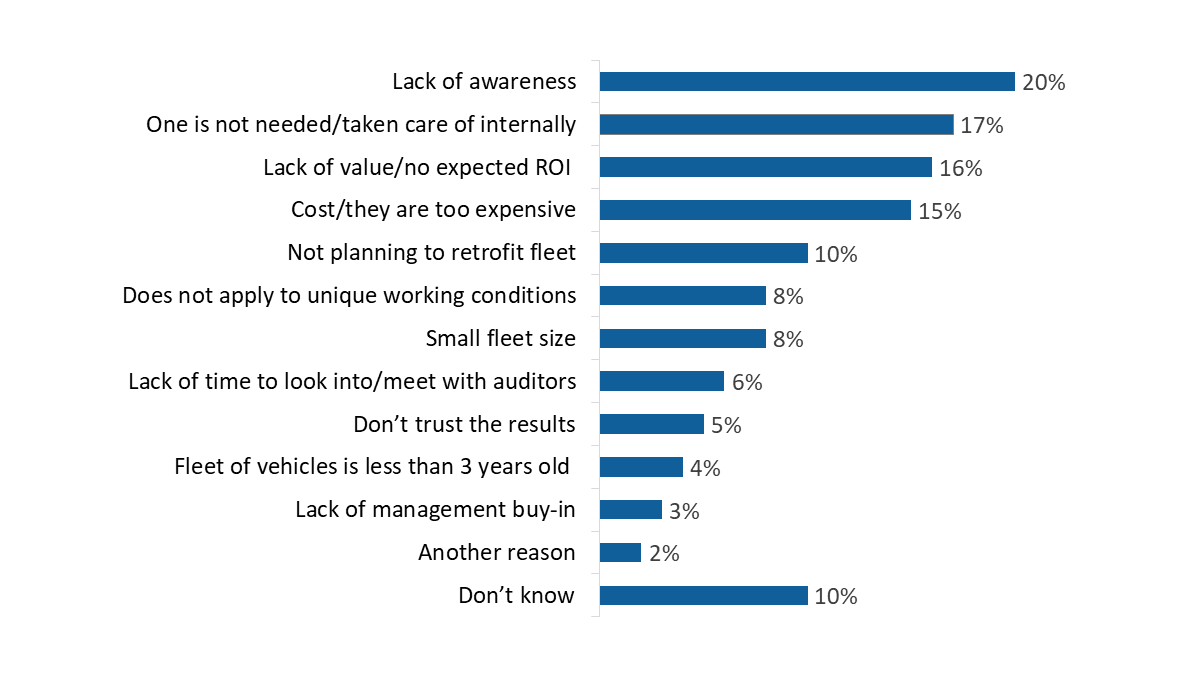
| Lack of awareness | 20% |
| One is not needed/taken care of internally | 17% |
| Lack of value/no expected ROI | 16% |
| Cost/they are too expensive | 15% |
| Not planning to retrofit fleet | 10% |
| Does not apply to unique working conditions | 8% |
| Small fleet size | 8% |
| Lack of time to look into/meet with auditors | 6% |
| Don’t trust the results | 5% |
| Fleet of vehicles is less than 3 years old | 4% |
| Lack of management buy-in | 3% |
| Another reason | 2% |
| Don’t know | 10% |
Q17. Would you please share the reason why your company has not considered conducting a fleet energy assessment? [Multiple responses accepted] Base: n=267; companies that have not considered a fleet energy assessment.
This section of the report discusses the retrofits implemented by companies in the past year. Respondents were reminded that retrofits are upgrades made to their trucks with energy efficient devices before responding to the questions in this section.
Seventy-four percent of companies have notimplemented retrofits to the trucks in their fleet in the past year. Unchanged from last year, one-quarter (24%) have implemented retrofits to their trucks.
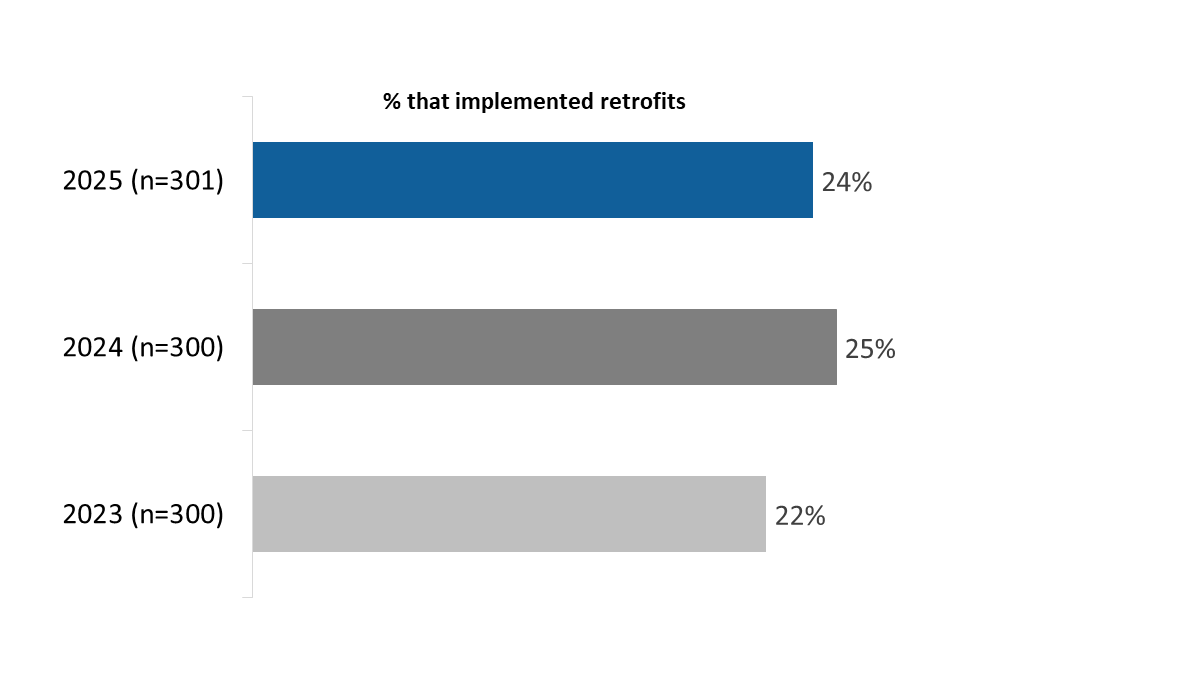
| % that implemented retrofits | |
| 2023 (n=300) | 22% |
| 2024 (n=300) | 25% |
| 2025 (n=301) | 24% |
Q18. In the past year, has your company implemented any retrofits to its truck fleet? Base: all respondents. [Don’t know 2025: 2%]
Companies based in Quebec (49%) and those with private fleets (33%) were more likely to have implemented retrofits in the past year. The likelihood of having implemented retrofits also was higher among companies familiar with federal green transportation programs (29%), those aware of provincial or territorial programs for greening freight transportation (37%), and those that have participated in a green transportation program. These findings are based on responses to Question 18, analyzed by responses to Question 4 (Company headquarters), Question 25 (Type of fleet), Question 8 (Familiarity with green transportation programs), Question 9 (Awareness of Provincial and Territorial programs), and Question 10 (Participation in green transportation programs).
The rest of the questions in this section of the report were asked only of companies that retrofitted trucks last year (n=71 companies).
Among companies that have retrofitted trucks last year (n=71), just over one-third (38%) retrofitted up to four trucks, including 18% that retrofitted just one. The majority (54%) retrofitted at least five trucks, up from 35% in 2024. The number of trucks retrofitted ranged from one to 100, with a median of five, up from three in 2024.
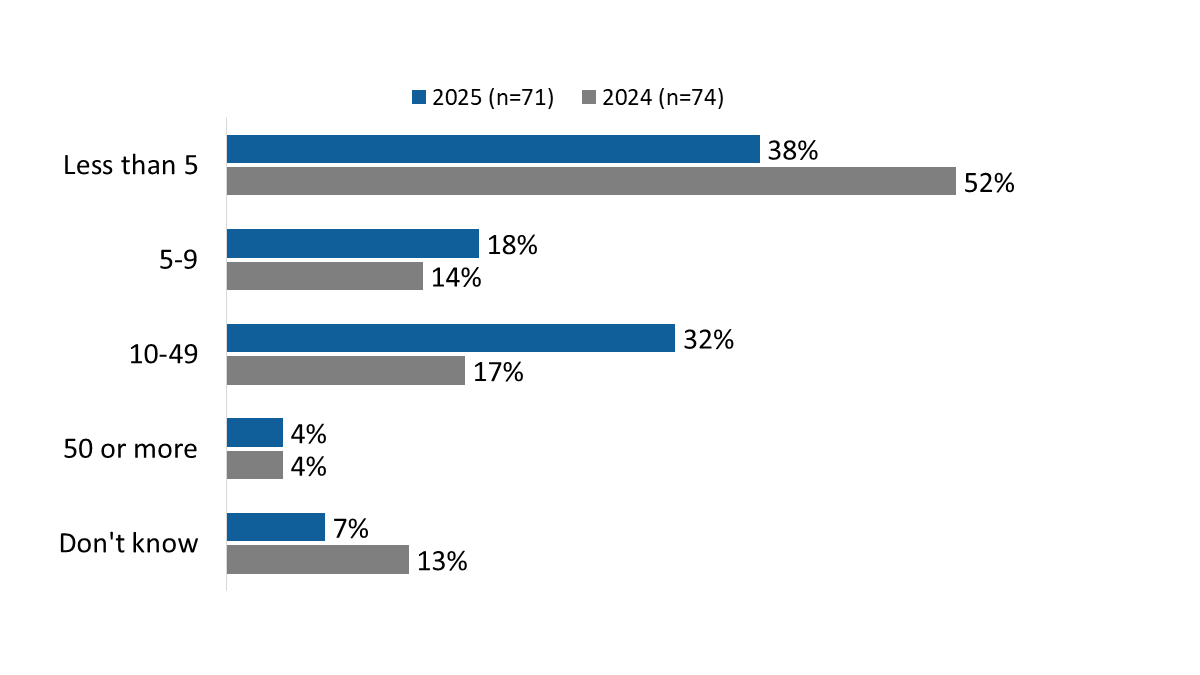
| 2025 (n=71) | 2024 (n=74) | |
| Less than 5 | 38% | 52% |
| 5-9 | 18% | 14% |
| 10-49 | 32% | 17% |
| 50 or more | 4% | 4% |
| Don't know | 7% | 13% |
Q19. How many trucks in your company´s fleet have been retrofitted in the past year? Base: companies that implemented retrofits.
Among companies that retrofitted trucks in 2024 (n=71), two-thirds (65%) installed cab heaters. Additionally, slightly more than four in 10 companies introduced telematics (46%), route optimization technology (44%), cab coolers (42%), and low rolling resistant tires (42%). Over one-third implemented trailer fairings or side skirts (38%), aerodynamic mud flaps (35%), and predictive cruise (35%). Figure 20 provides a full breakdown of the retrofits completed by these companies in the past year.
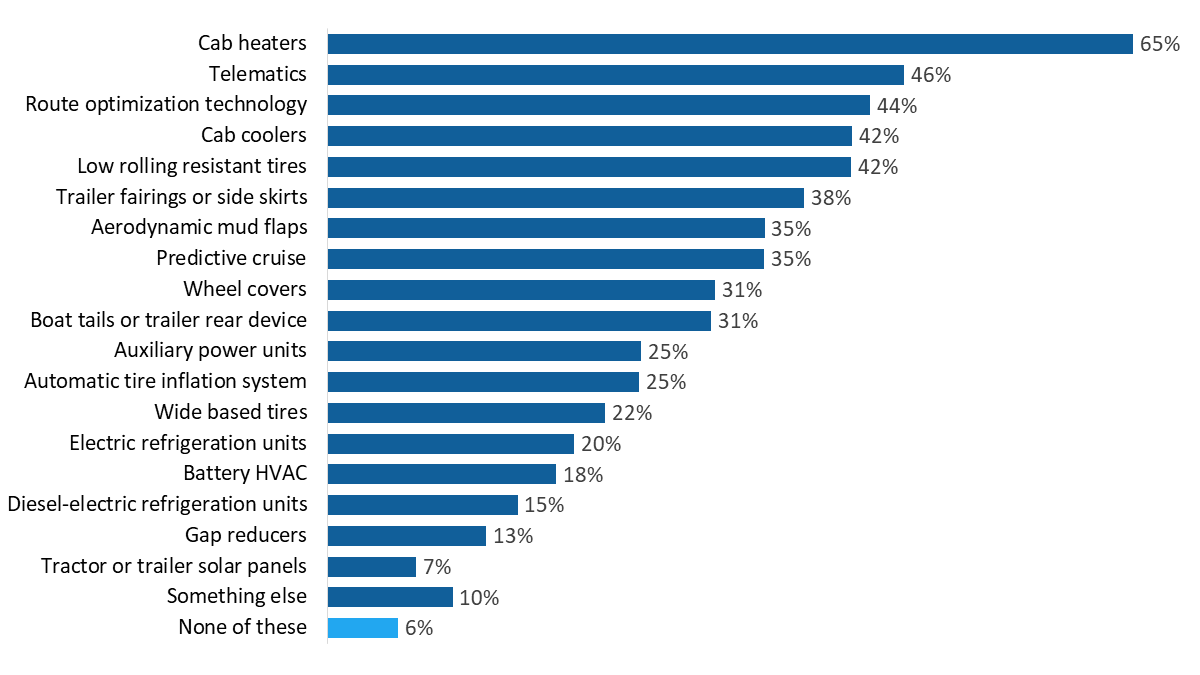
| Cab heaters | 65% |
| Telematics | 46% |
| Route optimization technology | 44% |
| Cab coolers | 42% |
| Low rolling resistant tires | 42% |
| Trailer fairings or side skirts | 38% |
| Aerodynamic mud flaps | 35% |
| Predictive cruise | 35% |
| Wheel covers | 31% |
| Boat tails or trailer rear device | 31% |
| Auxiliary power units | 25% |
| Automatic tire inflation system | 25% |
| Wide based tires | 22% |
| Electric refrigeration units | 20% |
| Battery HVAC | 18% |
| Diesel-electric refrigeration units | 15% |
| Gap reducers | 13% |
| Tractor or trailer solar panels | 7% |
| Something else | 10% |
| None of these | 6% |
Q20. Which of the following retrofits has your company completed in the past year? Base: n=71; companies that implemented retrofits. [Don’t know: 1%]
The table below shows the retrofits reported by companies for the past three surveys as well as the survey sample size for this question each year. Cab heaters continue to be the retrofit introduced by the largest proportion of companies.
| Type of Retrofit | 2025 (n=71) |
2024 (n=74) |
|---|---|---|
| Cab heaters | 65% | 58% |
| Telematics | 46% | 26% |
| Route optimization technology | 44% | 33% |
| Cab coolers | 42% | 44% |
| Low rolling resistant tires | 42% | 35% |
| Trailer fairings or side skirts (‘side skirts’ in 2024) | 38% | 23% |
| Aerodynamic mud flaps | 35% | 31% |
| Predictive cruise | 35% | 41% |
| Wheel covers | 31% | 23% |
| Boat tails or trailer rear device (‘boat tails’ in 2024) | 31% | 25% |
| Auxiliary power units | 25% | 41% |
| Automatic tire inflation system (added in 2025) | 25% | -- |
| Wide based tires | 22% | 16% |
| Electric refrigeration units | 20% | 19% |
| Battery HVAC | 18% | 31% |
| Diesel-electric refrigeration units | 15% | 23% |
| Gap reducers | 13% | 11% |
| Tractor or trailer solar panels | 7% | 4% |
Among companies that implemented retrofits last year (n=71), nearly three-quarters (72%) face barriers retrofitting their fleet. Over half (59%) of respondents identified cost as a barrier, up from 39% in 2024 and 29% in 2023.
Figure 22 provides a full breakdown of the barriers identified by respondents. The types of barriers grouped in the “other” category include lack of perceived benefits, the state of the Canadian economy, inaccessibility or reliability of federal government greening freight programs, the technology (i.e., it does not work properly), concerns about profitability and return on investment, and lack of fuelling infrastructure, among others.
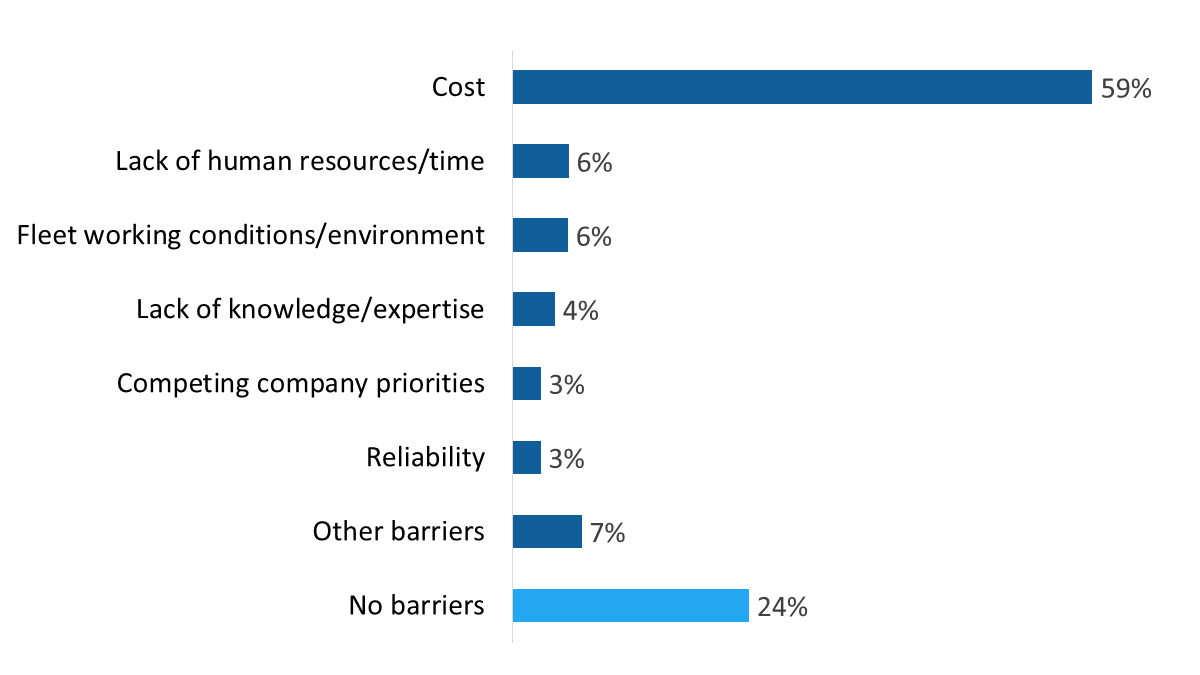
| Cost | 59% |
| Lack of human resources/time | 6% |
| Fleet working conditions/environment | 6% |
| Lack of knowledge/expertise | 4% |
| Competing company priorities | 3% |
| Reliability | 3% |
| Other barriers | 7% |
| No barriers | 24% |
Q21. What barriers, if any, does your company face when it comes to retrofitting its fleet? Base: n=71; companies that implemented retrofits. [Don’t know: 4%]
The table below presents the barriers mentioned by companies over the last three years. Keep in mind the smaller sample sizes (n=71 in 2025, n=74 in 2024, and n=65 in 2023).
| Type of Retrofit | 2025 (n=71) |
2024 (n=74) |
2023 (n=65) |
|---|---|---|---|
| Cost | 59% | 39% | 29% |
| Lack of human resources/time | 6% | 1% | 3% |
| Fleet working conditions/environment | 6% | 3% | 2% |
| Lack of knowledge/expertise | 4% | 2% | 7% |
| Competing company priorities | 3% | 3% | 1% |
| Reliability | 3% | 1% | 4% |
| Don’t know | 4% | 25% | 14% |
| No barriers | 24% | 23% | 37% |
This section of the report presents respondents’ views and actions in relation to refuelling or charging the trucks in their fleets.
Approximately one-third of companies refuel their fleet using on-site fuel tanks in (37%) and public CNG stations (34%). Seventeen percent use public stations or truck stops, 12% cardlock stations and 8% on-site charging stations. The full range of methods can be found in figure 24. In addition to the charging and fuelling methods displayed in the figure, 4% of respondents said their company uses other methods, including off-site fuel tanks, mobile fuel stations, and fueling networks.
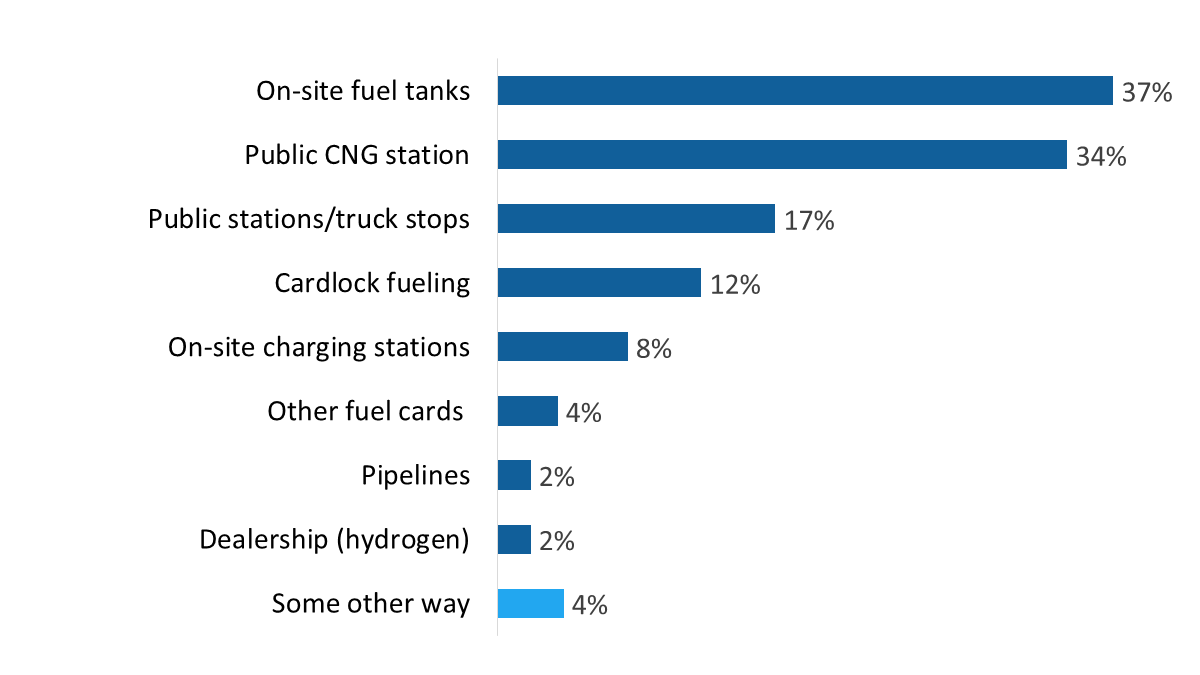
| On-site fuel tanks | 37% |
| Public CNG station | 34% |
| Public stations/truck stops | 17% |
| Cardlock fueling | 12% |
| On-site charging stations | 8% |
| Other fuel cards | 4% |
| Pipelines | 2% |
| Dealership (hydrogen) | 2% |
| Some other way | 4% |
Q22. How does your company charge or refuel its fleet? [Multiple responses accepted] Base: n=301; all respondents.
One in 10 (10%) freight representatives said their company is thinking about installing charging or refuelling infrastructure for zero emission trucks at their depot in the next three to five years. The majority (84%) are not.
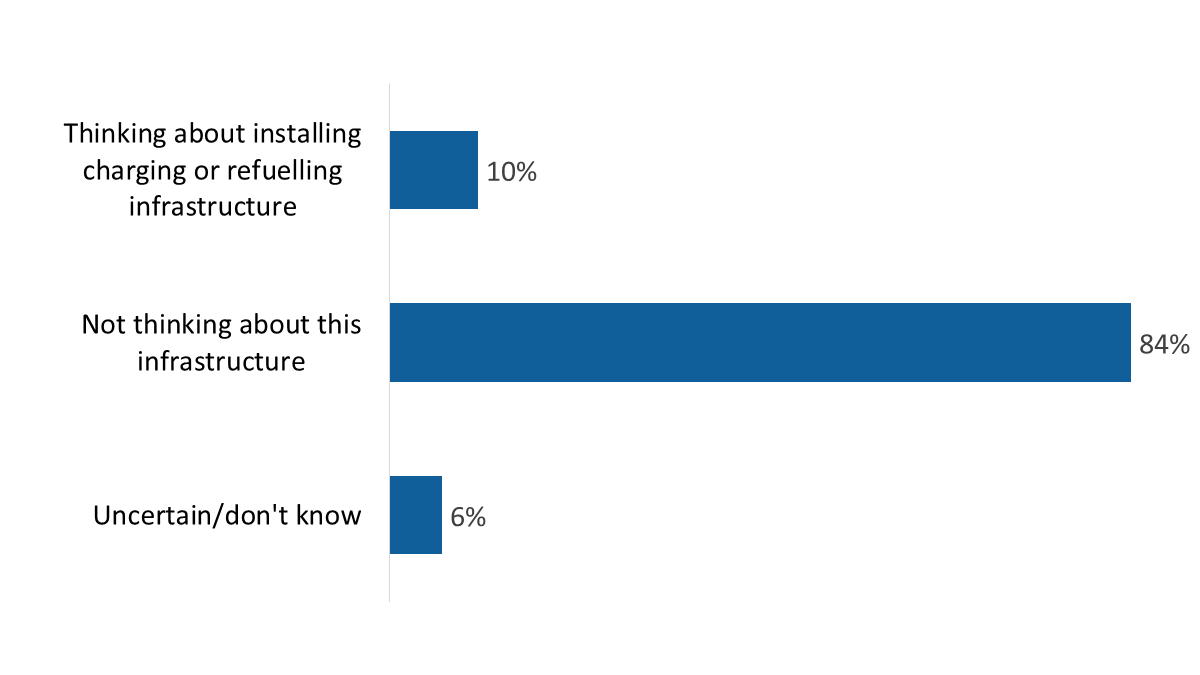
| Thinking about installing charging or refuelling infrastructure | 10% |
| Not thinking about this infrastructure | 84% |
| Uncertain/don't know | 6% |
Q23. Is your company thinking about installing charging or refuelling infrastructure for zero emission trucks at its private depot in the next 3-5 years? Base: n=301; all respondents.
Freight representatives who said their company is not considering installing charging or refuelling infrastructure (n=254) were asked why. In response, the top reason offered was cost—25% said it is too expensive.
After cost, the main reason was a perceived lack of need. Companies cited no plans to add zero-emission vehicles (20%), irrelevance to their work (19%), or simply not needing the infrastructure (15%). Other reasons included charging or refuelling infrastructure not being applicable to their location or yard size, not having any electric vehicles, having a small fleet, and planning to downsize or sell the company. The full breakdown of reasons can be found in figure 26.
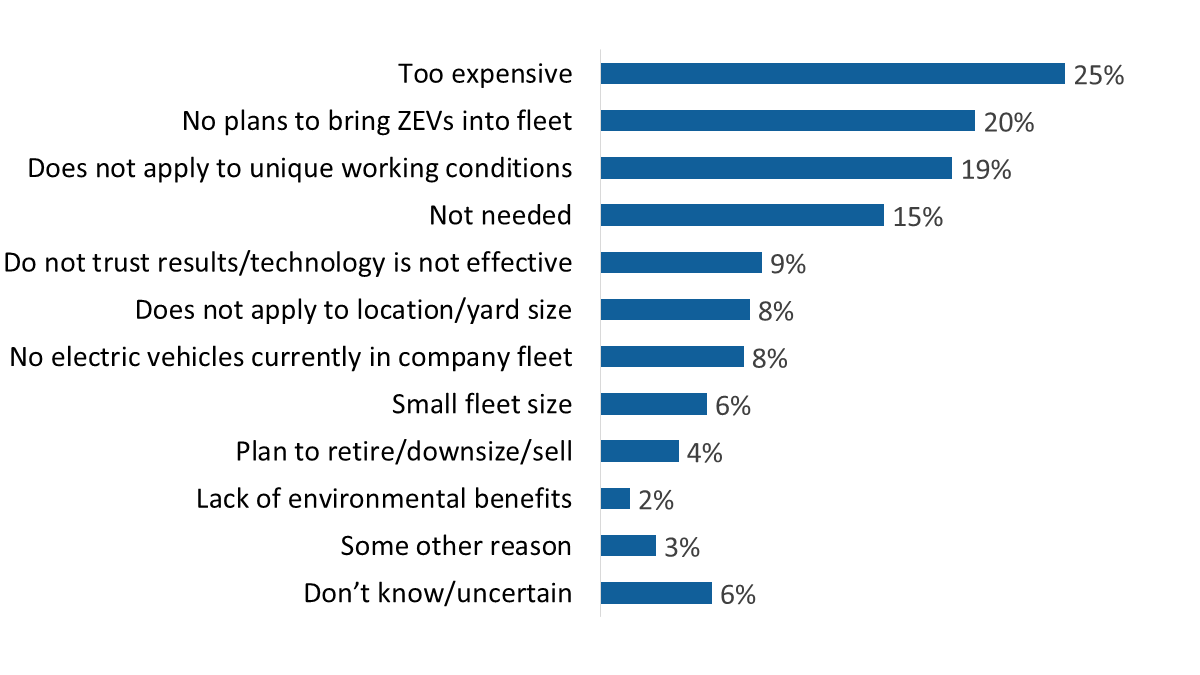
| Too expensive | 25% |
| No plans to bring ZEVs into fleet | 20% |
| Does not apply to unique working conditions | 19% |
| Not needed | 15% |
| Do not trust results/technology is not effective | 9% |
| Does not apply to location/yard size | 8% |
| No electric vehicles currently in company fleet | 8% |
| Small fleet size | 6% |
| Plan to retire/downsize/sell | 4% |
| Lack of environmental benefits | 2% |
| Some other reason | 3% |
| Don’t know/uncertain | 6% |
Q24. Why isn’t your company thinking about installing charging or refuelling infrastructure? [Multiple responses accepted] Base: n=254; companies not considering infrastructure.
Surveyed industry representatives were asked whether different types of information would be useful for decision-making about their company’s investments in fuel reducing technologies, initiatives, or programs.
Three-quarters (75%) viewed fuel consumption ratings for medium- and heavy-duty vehicles as useful for decision-making, while two-thirds (65%) viewed on-road performance of energy efficient technologies as useful. Similar proportions attributed value to data on the energy efficiency of Canada’s heavy-duty fleet (57%) and business cases for adopting energy efficient technologies and practices (56%). Exactly half (50%) thought that success stories on fleets transitioning to decarbonizing operations would be useful for decision-making.
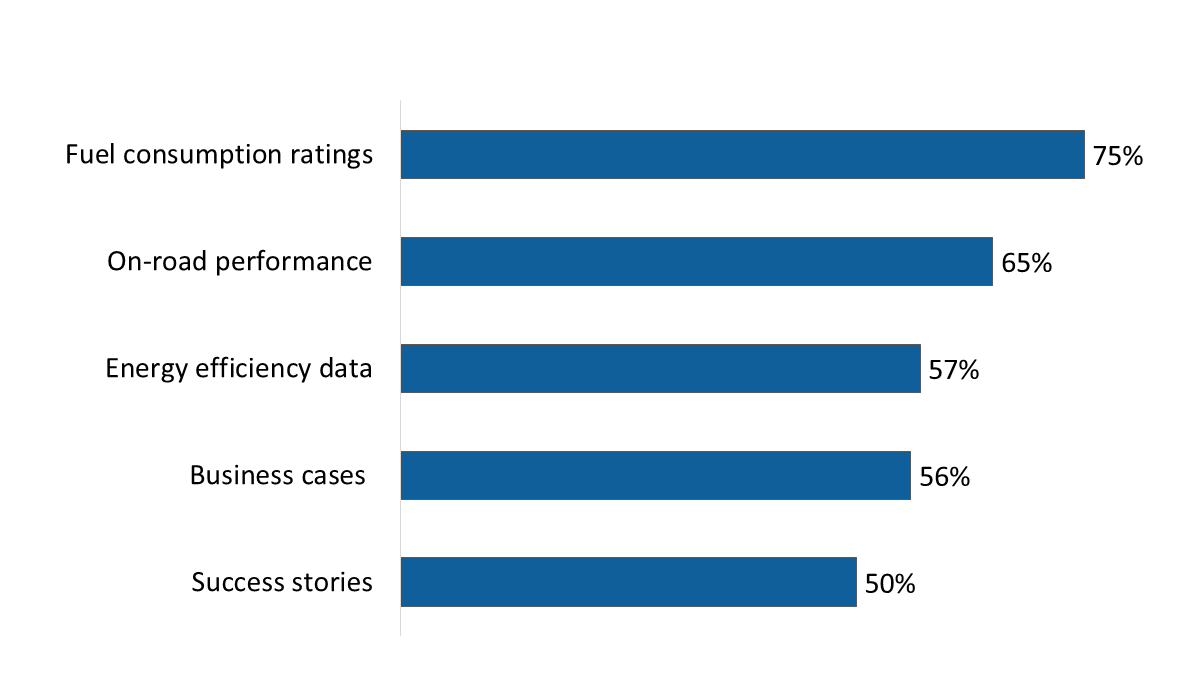
| Fuel consumption ratings | 75% |
| On-road performance | 65% |
| Energy efficiency data | 57% |
| Business cases | 56% |
| Success stories | 50% |
Q11. When it comes to decision-making about company investments in fuel reducing technologies, initiatives, or programs, are any of the following types of information useful? [Multiple responses accepted] Base: n=301; all respondents. [Don’t know: 1 to 3%]
The table below compares the 2025 results to those of 2022 and 2024. This question was not asked of survey respondents in 2023. The proportion of companies that considered each type of information to be useful to decision-making continues to increase.
| Type of Retrofit | 2025 (n=301) |
2024 (n=300) |
2022 (n=300) |
|---|---|---|---|
| Fuel consumption ratings | 75% | 65% | 47% |
| On-road performance | 65% | 58% | 49% |
| Energy efficiency data | 57% | 46% | 30% |
| Business cases | 56% | 54% | 37% |
| Success stories | 50% | 46% | 27% |
A substantial minority of companies (40%) provide training designed to improve drivers’ knowledge of fuel efficiency techniques. The incidence of eco-driving training is unchanged year over year, but compared to 2022, it has increased significantly. That year, only 17% of companies offered such training, whereas in 2025, the proportion has more than doubled to 40%.
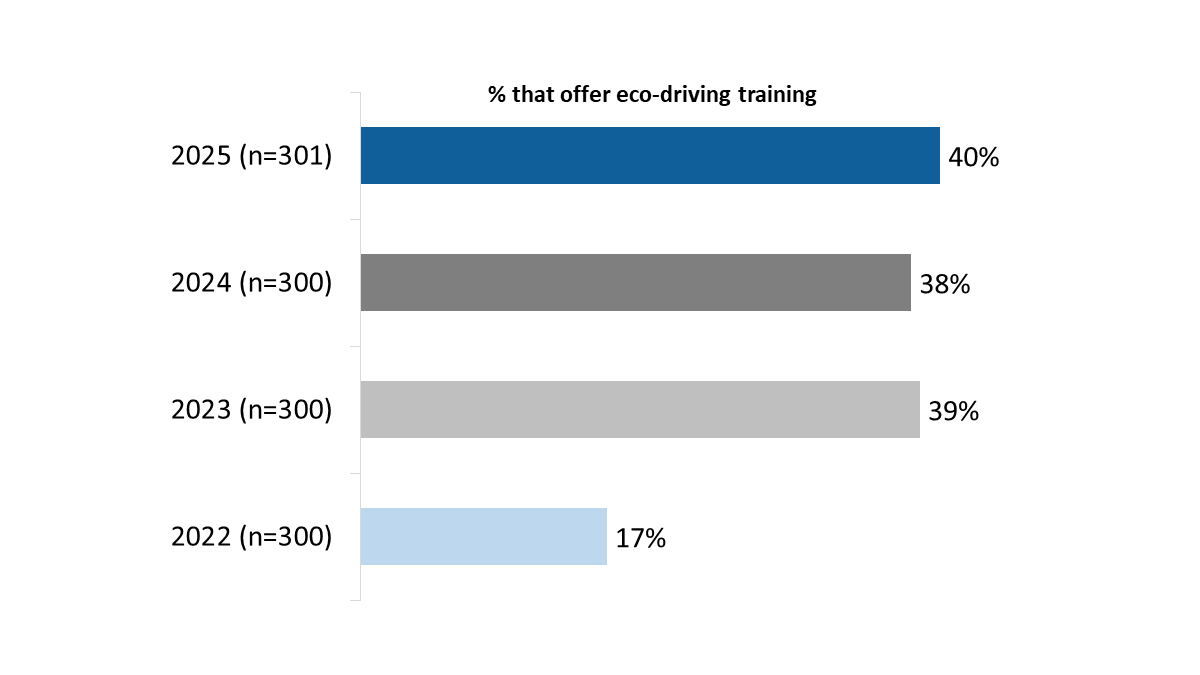
| 2022 (n=300) | 2023 (n=300) | 2024 (n=300) | 2025 (n=301) | |
| % that offer eco-driving training | 17% | 39% | 38% | 40% |
Q12. NRCan’s SmartDriver training series provides free, practical training to help commercial and institutional fleets lower their fuel consumption, operating costs and vehicle emissions while promoting safety. Does your company offer any training designed to improve drivers’ knowledge of fuel efficiency techniques? Base: all respondents. [Don’t know: 1%] *The wording of the question was changed slightly in 2025.
Companies with their head office in Quebec (72%), companies with fewer than five employees (73%), and those with fleets of fewer than five trucks (77%) were most likely to not offer eco-driving training. This finding is based on responses to Question 12, analyzed by responses to Question 4 (Company headquarters), Question 5 (Company size) and Question 27 (Fleet size).
As show in figure 30, most companies that do not offer eco-driving training (n=180) would consider offering the training for reasons related to safety (78%), fuel savings (75%), and staying competitive (70%).
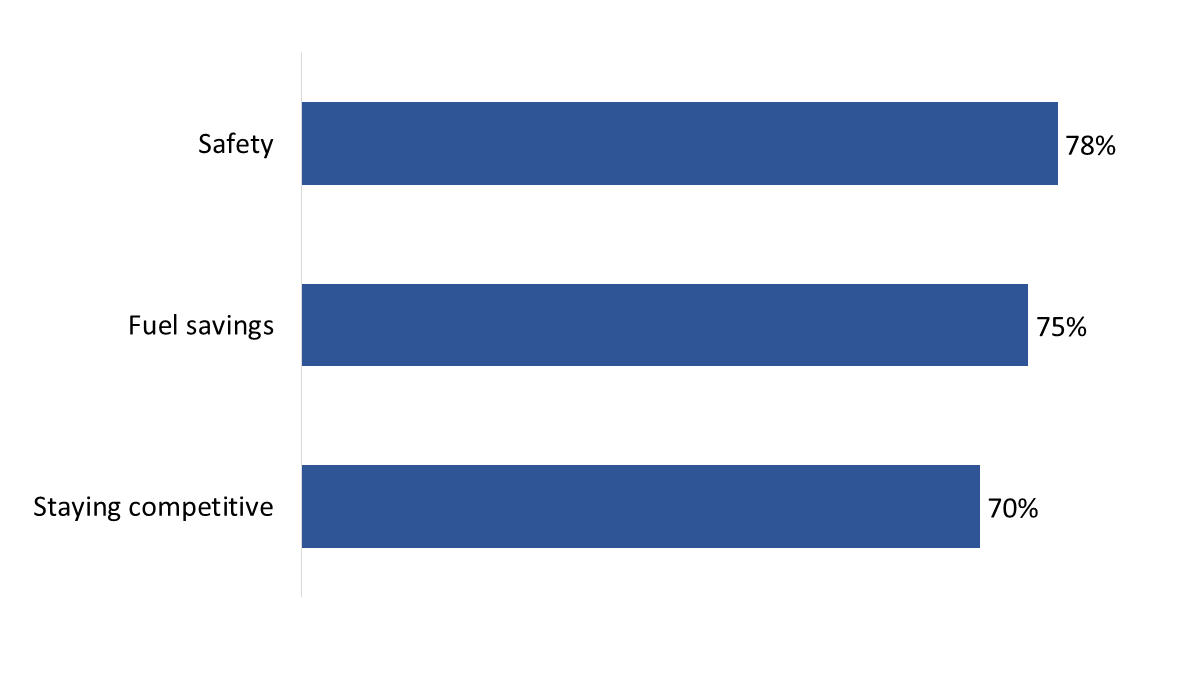
| Safety | 78% |
| Fuel savings | 75% |
| Staying competitive | 70% |
Q13. There are a number of reasons a company might consider offering training designed to improve drivers’ knowledge of fuel efficiency techniques. I’m going to read some of these reasons to you and I’d like you to tell me if this might be a reason your company would consider training. Base: n=180; companies that do not offer eco-driving training. [Don’t know: 1%]
Other reasonsFootnote 6 shared by respondents for considering driver training included cost savings (volunteered by 10% of respondents), to improve driver knowledge and training (6%), to improve general knowledge and awareness (5%), for equipment benefits (4%), and for environmental benefits (2%).
Many of the surveyed companies track fuel efficiency metrics. The vast majority track total kilometers travelled annually (91%) and the fuel consumption (85%) of their freight trucks. In addition, seven in 10 (71%) track driving habits, while approximately two-thirds each track the average speed of their trucks (67%) and idle time (64%). Close to half track empty kilometers travelled annually (49%) and annual average payload (48%).
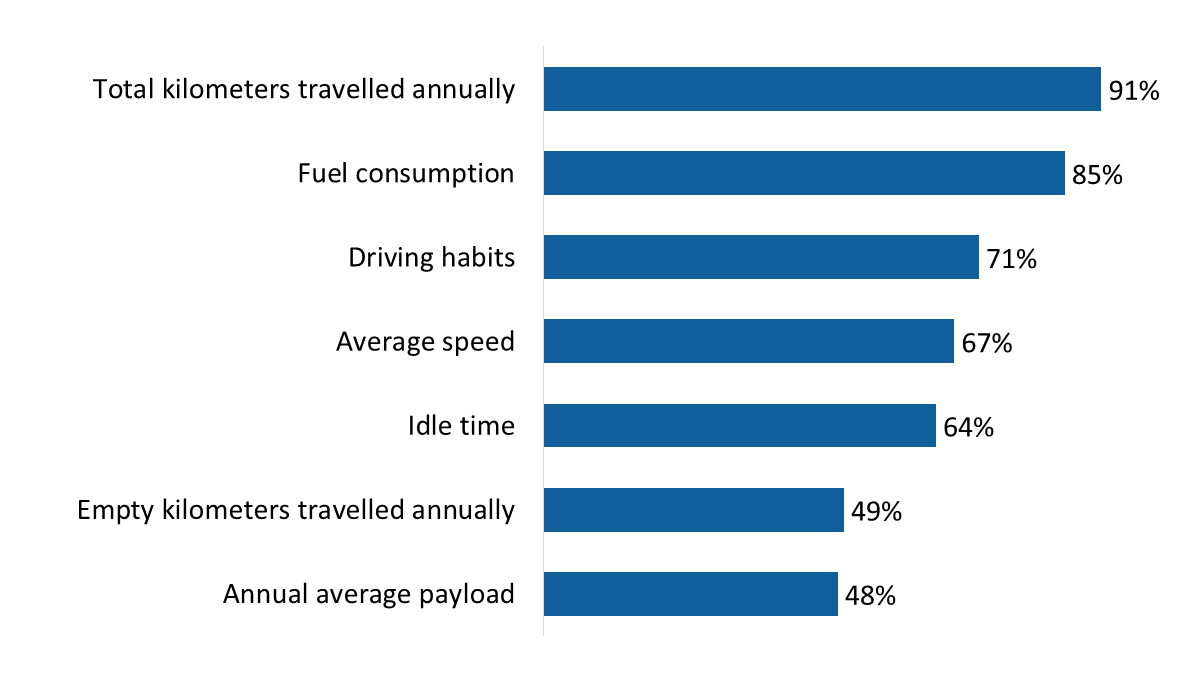
| Annual average payload | 48% |
| Empty kilometers travelled annually | 49% |
| Idle time | 64% |
| Average speed | 67% |
| Driving habits | 71% |
| Fuel consumption | 85% |
| Total kilometers travelled annually | 91% |
Q34. Thinking about the freight trucks that your company uses, which of the following do you track? Base: n=301; all respondents.
The table below compares the 2025 results to those of 2018, 2022 and 2024. This question was not asked of survey respondents in 2023. Compared to 2024, this year more companies are tracking the total kilometers travelled annually, while fewer are tracking average speed and annual average payload.
| Measures | 2025 (n=301) | 2024 (n=300) | 2022 (n=300) | 2018 (n=300) |
|---|---|---|---|---|
| Total kilometers travelled annually | 91% | 85% | 89% | 89% |
| Fuel consumption | 85% | 85% | 90% | 91% |
| Driving habits | 71% | 71% | 69% | 66% |
| Average speed | 67% | 75% | 65% | 70% |
| Idle time | 64% | 65% | 63% | 70% |
| Empty kilometers travelled annually | 49% | 50% | 51% | 58% |
| Annual average payload | 48% | 54% | 52% | 53% |
Representatives of companies that track efficiency metrics (n=292) were asked what methods they use to do so. Exactly half (50%) use electronic logging devices. Approximately one-quarter each use telematics devices (26%) or manual calculation (24%). The rest use GPS tracking (6%), a dash camera (2%), or another method (3%).
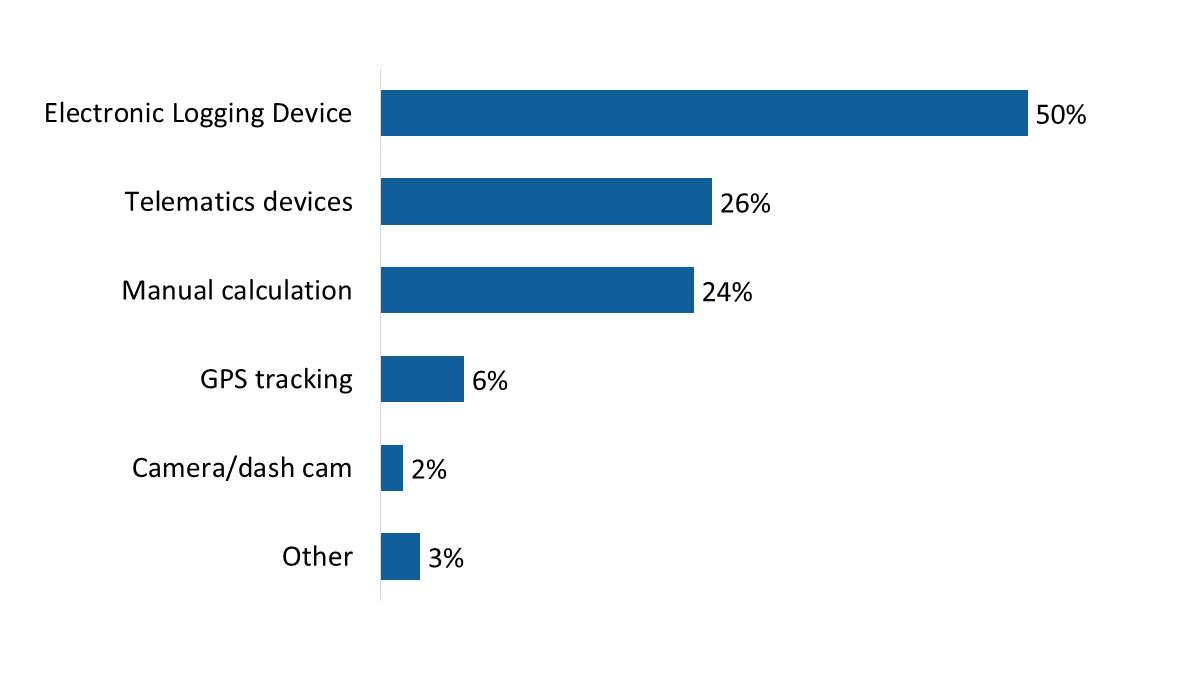
| Electronic Logging Device | 50% |
| Telematics devices | 26% |
| Manual calculation | 24% |
| GPS tracking | 6% |
| Camera/dash cam | 2% |
| OTHER | 3% |
| Don’t know | 3% |
Q35. What methods, if any, does your company use to track these things? [Multiple responses accepted] Base: n=292; companies that track efficiency metrics. [Don’t know: 3%]
The following specifications applied to this survey:
| NAICS code | No. of interviews |
|---|---|
| General freight: local (484110) – These companies primarily provide same-day return trucking services within a metropolitan area and its hinterland. | 127 |
| General freight: long distance (484121, 484122) – These companies primarily provide long distance, general freight trucking of complete truckloads. | 155 |
| Specialized freight trucking excluding used goods (484220, 484230) – These companies primarily provide local transportation of specialized freight (except used goods) using trucks without storage facilities. | 19 |
| Total Numbers Attempted | 16,047 |
| Out-of-scope - Invalid | 3,887 |
| Unresolved (U) | 8,823 |
| No answer/answering machine | 8,823 |
| In-scope - Non-responding (IS) | 2,746 |
| Language barrier | 48 |
| Incapable of completing (ill/deceased) | 99 |
| Respondent refusal | 1,879 |
| Callback scheduled/not completed | 695 |
| Termination | 25 |
| In-scope - Responding units (R) | 591 |
| Completed interview | 301 |
| Quota reached | 6 |
| Not eligible | 290 |
| Response Rate Footnote 7 [R=R/(U+IS+R)] | 5% |
| NAICS code | Unweighted No. of interviews |
Weighted No. of interviews |
|---|---|---|
| General freight: local | 127 | 130 |
| General freight: long distance | 155 | 156 |
| Specialized freight trucking excluding used goods | 19 | 15 |
1st POINT OF CONTACT/GATEKEEPER:
Hello/bonjour, my name is [Interviewer’s name]. Would you prefer to continue in English or French? / Préférez-vous continuer en anglais ou en français? May I speak to someone at your company who is most familiar with fuel efficiency tracking and management within your organization?
IF ASKED BY GATEKEEPER:
I’m calling on behalf of Phoenix SPI, a public opinion research company. We’re conducting a survey for Natural Resources Canada, a department of the Government of Canada, about important issues facing the freight transportation industry. May I speak to the person who is most familiar with the fuel efficiency programs and policies within your company’s fleet of vehicles?
RESPONDENT:
Hello/Bonjour, my name is [INSERT NAME]. I’m calling on behalf of Phoenix SPI, a public opinion research company. We’re conducting a survey for Natural Resources Canada, a department of the Government of Canada, with people who have knowledge about fuel efficiency tracking and management within the freight transportation industry. The results of this study will help inform future public policy to help Canadian fleets lower their fuel consumption, operating costs and vehicle emissions.
The survey takes about 15 minutes and is voluntary. Your responses will be kept confidential and anonymous, and the information provided will be administered according to the requirements of the Privacy Act, the Access to Information Act, and any other pertinent legislation.
This survey is registered with the Canadian Research Insights Council’s survey validation system.
May I continue?
INTERVIEWER NOTE: IF A RESPONDENT ASKS ABOUT THE LEGITIMACY OF THIS SURVEY, SAY: This survey is registered with the Canadian Research Insights Council’s survey validation system. The registration number is 20241120-PH860.
A. Screening and Quotas
Before we start,
1. May I confirm that your company operates freight transportation trucks?
INTERVIEWER NOTE: IF ASKED WHAT FREIGHT TRANSPORTATION TRUCKS ARE, SAY: These typically include medium- and heavy-duty trucks used for moving goods and does not include vans.
2. How knowledgeable would you say you are with the fuel efficiency programs and policies within your company’s fleet of vehicles? This includes the tracking of things like fuel consumption and kilometres travelled, as well as the management or implementation of such programs and policies. Are you… [READ LIST]
3. [IF Q2=02] Can you direct me to someone at your company that is knowledgeable about the tracking, management or implementation of fuel efficiency programs and policies within your company?
4. In which province or territory is your company’s head office located? [DO NOT READ LIST]
5. How many employees work for your company? Please include part-time employees as full-time equivalents. [DO NOT READ LIST]
6. And, how many of these employees are employed as drivers for your company?
B. Government Programs
7. In your view, how important, if at all, are federal government funding programs that support fleet retrofits? [READ LIST] [PROVIDE DEFINITION OF RETROFITS: ‘By retrofits we are referring to upgrades made to your truck(s) with energy efficient devices. This could include, but is not limited to side skirts, boat tails, wheel covers, wide based tires, low rolling resistant tires, etc.’]
8. Using a scale of 1 to 5 where 1 is not at all familiar and 5 is very familiar, how familiar are you with the following federal green transportation programs? [IF ASKED, PROVIDE THIS DEFINITION OF GREEN TRANSPORTATION PROGRAMS: Green transportation programs typically focus on things like improving fuel efficiency, reducing greenhouse gas emissions, using cleaner fuels, supporting zero-emission vehicles, and raising awareness or offering incentives to adopt these practices.] [READ LIST]
[RANDOMIZE]
[RESPONSE OPTIONS]
9. Are you aware of any [INSERT BASED ON Q4: provincial / territorial] programs for greening freight transportation? [IF READ AT Q8, ADD: “Just a reminder”.] Green transportation programs typically focus on things like improving fuel efficiency, reducing greenhouse gas emissions, using cleaner fuels, supporting zero-emission vehicles, and raising awareness or offering incentives to adopt these practices.
10. Which green transportation programs, if any, does your company participate in? [IF NEEDED, REMIND THE RESPONDENT: Green transportation programs focus on things like improving fuel efficiency, reducing greenhouse gas emissions, using cleaner fuels, supporting zero-emission vehicles, and raising awareness or offering incentives to adopt these practices] [DO NOT READ LIST; ACCEPT MULTIPLE RESPONSES]
11. When it comes to decision-making about company investments in fuel reducing technologies, initiatives or programs, are any of the following types of information useful? [READ LIST; PAUSE FOR A YES/NO AFTER EACH]
[RANDOMIZE]
[RESPONSE OPTIONS]
12. NRCan’s SmartDriver training series provides free, practical training to help commercial and institutional fleets lower their fuel consumption, operating costs and vehicle emissions while promoting safety. Does your company offer any training designed to improve drivers’ knowledge of fuel efficiency techniques?
13. [IF Q12=02, 03] There are a number of reasons a company might consider offering training designed to improve drivers’ knowledge of fuel efficiency techniques. I’m going to read some of these reasons to you and I’d like you to tell me if this might be a reason your company would consider training. The first one is [INSERT ITEM]. [READ LIST; PAUSE FOR A YES/NO AFTER EACH]
[RANDOMIZE]
[RESPONSE OPTIONS]
14. [IF Q12=02, 03] For what other reasons, if any, would your company consider offering driver training designed to improve knowledge of fuel efficiency techniques?
C. Fleet Energy Assessments
Changing topics,
15. Has your company ever had a third party conduct an energy assessment of your fleet? An energy fleet assessment is an analysis of your fleet’s performance that can be used to help your company decide whether to invest in fuel-reducing technologies and upgrade your truck(s) with energy efficient devices.
16. [IF Q15=01] How important are fleet energy assessments when determining which retrofits should be made to your fleet? Retrofits are upgrades made to your truck(s) with energy efficient devices. [READ LIST]
Skip to Q18 Unless Q15=02 or 03
17. [IF Q15=02,03] Would you please share the reason why your company has not considered conducting a fleet energy assessment? [DO NOT READ LIST; ACCEPT MULTIPLE RESPONSES]
D. Retrofits
These next questions are about retrofits to your company’s freight transportation trucks. Retrofits are upgrades made to your truck(s) with energy efficient devices.
18. In the past year, has your company implemented any retrofits to its truck fleet?
19. [IF Q18=01] How many trucks in your company’s fleet have been retrofitted in the past year?
20. [IF Q18=01] Which of the following retrofits has your company completed in the past year? [RANDOMIZE/READ LIST; ACCEPT MULTIPLE RESPONSES] [INTERVIEWER NOTE: IF ASKED, PLEASE REMIND RESPONDENTS THAT WE ARE ASKING ABOUT RETROFITS TO EXISTING TRUCKS.]
21. What barriers, if any, does your company face when it comes to retrofitting its fleet? [DO NOT READ LIST; ACCEPT MULTIPLE RESPONSES]
E. Repowering and Charging/Refuelling Infrastructure
Changing topics again,
22. How does your company charge or refuel its fleet? [DO NOT READ; IF HELPFUL, PROMPT BY READING SOME ITEMS; ACCEPT MULTIPLE RESPONSES]
23. Is your company thinking about installing charging or refuelling infrastructure for zero emission trucks at its private depot in the next 3-5 years?
24. [IF Q23=02] Why isn’t your company thinking about installing charging or refuelling infrastructure? [DO NOT READ; ACCEPT MULTIPLE RESPONSES]
F. Fleet Profile
These last questions are about your company’s fleet.
25. Is your fleet… [READ LIST]
26. Are the trucks in your fleet… [READ LIST]
27. How many trucks are in your company’s fleet?
28. How many trucks in your company’s fleet are powered by diesel?
29. [IF Q28≠ 01] How many trucks in your company’s fleet are powered by an alternative fuel to diesel, for example, propane, compressed natural gas, renewable natural gas, electricity, hydrogen fuel cell, or ethanol?
30. [IF Q28 ≠ 01] Which alternative fuel types to diesel does your company’s fleet currently use? [DO NOT READ; ACCEPT MULTIPLE RESPONSES]
31. How many trucks in your fleet are less than five years old?
32. What type of trucks are in your company’s fleet? [IF HELPFUL, PROMPT BY READING SOME ITEMS; ACCEPT MULTIPLE RESPONSES; IF A RESPONDENT MENTIONS A BRAND OF TRUCK, SAY: FOR THIS QUESTION, WE’RE INTERESTED IN THE TYPE OF TRUCK NOT THE BRAND] INTERVIEWER NOTE: IF UNCLEAR WHICH CODE TO ASSIGN THE RESPONSE, DO NOT CLARIFY WITH THE RESPONDENT. CODE THE ANSWER AS 16 AND ENTER THE RESPONSE.
33. Are your trucks used for… [READ LIST; ACCEPT MULTIPLE RESPONSES]
34. Now, thinking about the freight trucks that your company uses, which of the following do you track? [READ LIST; PAUSE FOR A YES/NO AFTER EACH]
[RANDOMIZE; ROTATE C AND D AS A BLOCK RANDOMIZING THE ORDER OF C AND D]
Response Options
35. [IF Q34=01 TO ANY ITEM] What methods, if any, does your company use to track these things like [INSERT ONE ITEM MENTIONED AT Q34]? [DO NOT READ LIST; ACCEPT MULTIPLE RESPONSES] INTERVIEWER NOTE: IF UNCLEAR WHETHER THE RESPONSE SHOULD BE CODED AS 01, 02 OR 03, DO NOT CLARIFY WITH THE RESPONDENT. CODE THE ANSWER AS 04 AND ENTER THE RESPONSE.
Finally,
36. What’s your position within the company? [DO NOT READ LIST. ACCEPT ONE RESPONSE]
Thank you very much for your time and participation. The results of the research will be available to the general public, on the Library and Archives website, in the coming months.