Encouraging Export Diversification for Canadian Small and Medium-Sized Businesses: Quantitative and Qualitative Research on Free Trade Agreements
Final Report
Prepared for Global Affairs Canada
Supplier Name: Phoenix SPI
Contract Number: 08915-180520/001/CY
Contract Value: $132,465.95 (including HST)
Award Date: 2019-01-31
Delivery Date: 2019-06-03
Registration Number: POR 115-18
For more information on this report, please contact Global Affairs Canada at: POR-ROP@international.gc.ca
Ce rapport est aussi disponible en français.
Encouraging Export Diversification for Canadian Small and Medium-Sized Businesses: Quantitative and Qualitative Research on Free Trade Agreements
Final Report
Prepared for Global Affairs Canada
Supplier name: Phoenix Strategic Perspectives Inc.
June 2019
This public opinion research report presents the results of an online survey of 507 export-oriented companies and set of 40 in-depth telephone interviews conducted by Phoenix SPI on behalf of Global Affairs Canada. The fieldwork for the research took place between March and April 2019.
This publication may be reproduced for non-commercial purposes only. Prior written permission must be obtained from Global Affairs Canada. For more information on this report, please contact Global Affairs Canada at:
Communications Branch
Public Services and Procurement Canada
Portage III Tower A
16A1-11 Laurier Street
Gatineau QC K1A 0S5
Catalogue number:
FR5-159/2019E-PDF
International Standard Book Number (ISBN):
978-0-660-30924-8
Related publications (registration number: POR 115-18):
Catalogue number FR5-159/2019F-PDF (Final report, French)
ISBN 978-0-660-30925-5
© Her Majesty the Queen in Right of Canada, as represented by the Minister of Foreign Affairs, Canada, 2019
Cette publication est aussi disponible en français sous le titre : Promouvoir la diversification des exportations des petites et moyennes entreprises canadiennes: une recherche quantitative et qualitative sur les accords de libre-échange.
Table of Contents
List of Figures
Executive Summary
Phoenix Strategic Perspectives Inc. (Phoenix SPI) was commissioned by Global Affairs Canada (GAC) to conduct quantitative and qualitative research in support of export diversification.
Background and Objectives
In alignment with the Minister of International Trade Diversification’s mandate letter, GAC is pursuing efforts to help Canadian companies diversify their exports abroad. The Free Trade Agreement Promotion Task Force was established to promote Free Trade Agreements (FTAs) through outreach to Canadian companies and training Canada’s trade commissioners. The Task Force had been in place for three years. GAC, therefore, wanted to collect baseline data on Canadian small and medium-sized businesses’ (SMEs) awareness of Canada’s FTAs, the extent to which these businesses are taking advantage of FTAs already in place, and the challenges SMEs see vis-à-vis diversifying their export markets.
The objectives of the research were to determine:
- Canadian SMEs’ awareness of Canada’s free trade agreements, with a focus on the Canada-EU Comprehensive Economic and Trade Agreement (CETA), the Comprehensive and Progressive Trans-Pacific Partnership (CPTPP), the Canada-Korea Free Trade Agreement, the Canada-Israel Free Trade Agreement, and the Canada-Ukraine Free Trade Agreement;
- businesses’ intentions regarding FTA utilization;
- the level of understanding by SMEs of the benefits and requirements of Canada’s FTAs (in terms of tariffs, rules of origin, procurement, labour mobility etc.);
- Canadian SMEs’ experience using FTAs, including the impact of FTAs on decision processes, and the barriers that prevent businesses from using FTAs;
- what information and programming support Canadian companies require to diversify their exports; and
- from which sources Canadian companies prefer to receive business-related information.
The findings from this research will be used by GAC to shape its FTA promotion strategy to better meet the needs of SMEs and provide a better client experience for Canadian companies that would like to diversify their exports.
Methodology
Qualitative and quantitative research was conducted with the target population: Canadian SMEs that export. This included an online survey administered to 507 Canadian SMEs that export and a set of 40 in-depth, one-on-one telephone interviews conducted with a sub-sample of survey respondents. Specifically:
- The online survey averaged 15 minutes to complete. The sample was drawn from the business panels of Dynata and Maru/Blue. Panellists were invited to participate in the survey through an email invitation which contained a password-protected URL to access the survey. Survey data was weighted by region and business size to reflect the composition of the target population. Surveys that use samples drawn from online panels cannot be described as statistically projectable to the target population. No estimates of sampling error can be calculated because the sample is based on those who initially self-selected for participation in the panel. The fieldwork was conducted between March 19 and April 1, 2019.
- A set of 40 in-depth, one-on-one telephone interviews were conducted with a sub-sample of survey respondents. Interviews were conducted in the individuals’ official language and averaged approximately 30 minutes. All interviews were completed between March 28 and April 10, 2019. Participants received an honorarium of $150 in appreciation of their time.
Additional methodological information is available in the appendix.
Summary of Findings
Exporting Activities
Majority of SMEs export to the U.S. and other foreign markets.
-
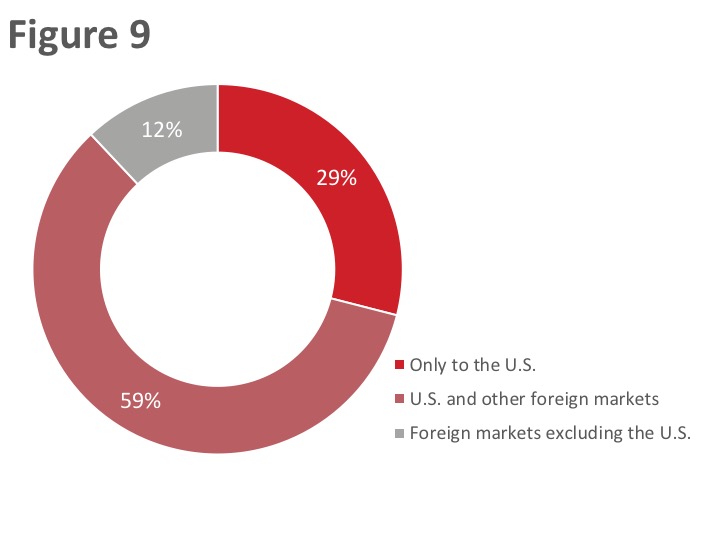
More than half (59%) the companies surveyed export to the United States (U.S.) and other foreign markets. In contrast, approximately three in ten (29%) export only to the U.S. and 12% to foreign markets, excluding the United States.
- Most interview participants indicated that their company began with a domestic focus and then later developed an international focus. Reasons for companies to begin immediately with an international focus included: the fact that the markets for the company’s products are primarily outside Canada, the opportunity to ‘piggy-back’ on large international companies, the need for larger market opportunities to offset production costs, and personal experience or contacts.
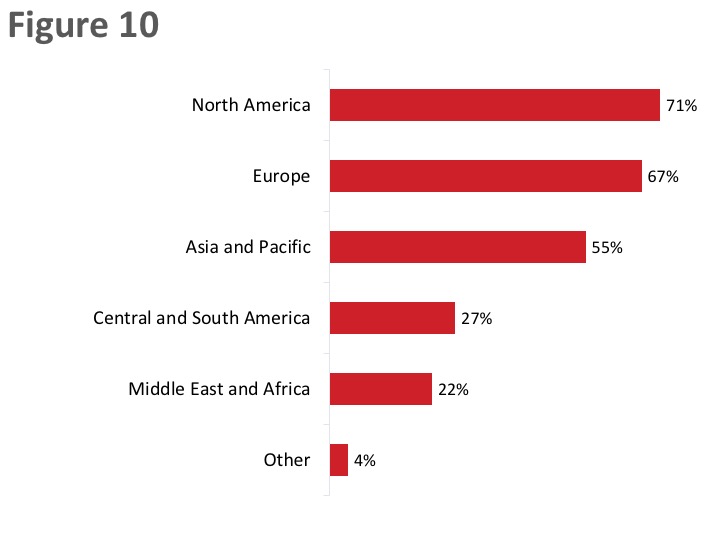
- Among companies that export goods or services, North America (71%) is the top destination, followed by Europe (67%) and the Asia-Pacific region (55%). Fewer companies currently export to countries in Central or South America (27%) and to the Middle East or Africa (22%).
-
At the country level:
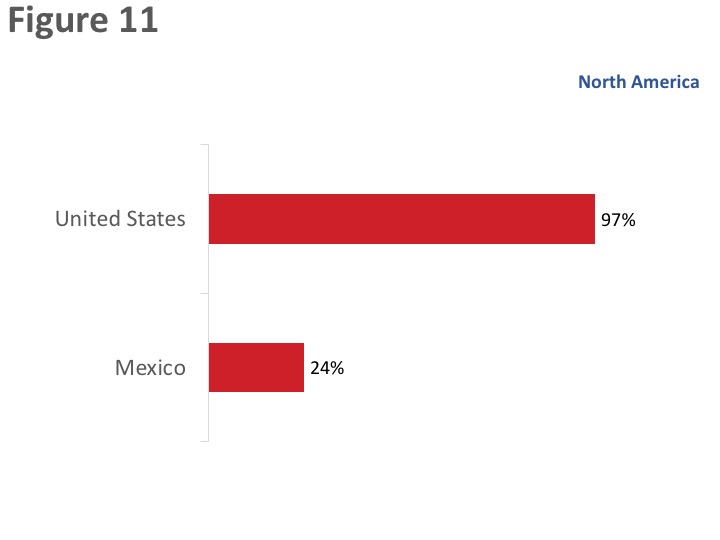
- The U.S. (97%) is the top export destination among companies that currently export to North America.
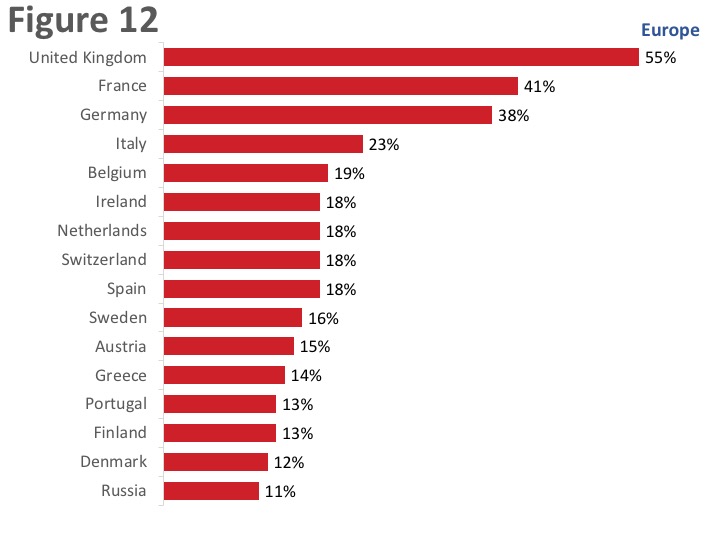
- The United Kingdom (55%), followed by France (41%), and Germany (38%) are the top destinations among companies that currently export to Europe.
- Among companies currently exporting to Asia-Pacific region, 49% export to Australia. Following Australia are China (36%), Japan (32%), New Zealand (26%), Hong Kong (20%), India (20%) and Taiwan (17%).
- Brazil is the top export destination in Central and South America—42% of respondents said their company currently exports to Brazil, while 26% export to Chile, 22% to Argentina, and 22% to Colombia.
- The United Arab Emirates (36%), Israel (35%), and South Africa (32%) are top export destinations in the Middle East and Africa.
- In terms of export diversification, one-third of companies are not interested in any other markets at this time. Among those companies that are planning to enter new markets, Australia (20%), followed by New Zealand (15%) and the United Kingdom (14%), were the top destinations.
Exporting Obstacles and Assistance
Canadian SMEs face numerous challenges in relation to their activities in international markets.
-
The value of the Canadian dollar is the top challenge experienced by companies—for 69% of companies, it is at least a minor obstacle to their company’s activities in international markets. Other challenges experienced by majorities of companies when it comes to their activities in international markets include: uncertainty of the regulatory requirements in other countries (67%), lack of market contacts (64%), foreign tariffs and trade barriers (63%), lack of information on business opportunities (62%), linguistic or cultural obstacles (57%), lack of access to financing and funding (53%), and Canadian export taxes or permits (53%).
- Interview participants echoed, as well as elaborated on, these challenges. In particular, for smaller firms, and companies that recently started international activities, making connections and networking as well as financial assistance were described as important challenges—the former because it is important to have knowledgeable ‘people on the ground’ to facilitate entry into a foreign market, and the latter because smaller firms many not have the cash flow available to support international business opportunities.
Canadian SMEs require at least a little assistance in many areas when developing business in markets outside of Canada.
-
Areas in which Canadian SMEs were more likely to require some or a great deal of assistance include market intelligence and information (48%), referrals to international sales leads (47%), understanding business practices in foreign markets (45%), and information about companies in foreign markets (43%).
- Interview participants provided more detailed insights into the types of assistance that would help their company address challenges related to their international business activities.Specifically, participants mentioned advice on legal issues, taxation, use of free trade agreements, international standards for products and services, and general information about how to operate in different regions.
- Other types of assistance mentioned with frequency were financial assistance to help expand to international markets, foreign contacts to implement market plans (“boots on ground”), competitive intelligence, as well as business leads and foreign contacts.
- Areas in which companies are less likely to require assistance are referrals of technology and/or R&D partnership opportunities (47% of companies require no assistance), information or advice on locating financial/funding assistance financial advice (45% require no assistance), and practical advice on timing and organizing your business trip (44% require no assistance).
Awareness and Use of Free Trade Agreements
Among Canadian SMEs, there was fairly low awareness of Canada’s free trade agreements.
- Representatives of exporting companies were most likely to be aware of the Comprehensive and Progressive Trans-Pacific Partnership (CPTPP) (74%) and the Canada-European Union Comprehensive Economic and Trade Agreement (CETA) (72%). That said, only 7% of respondents said they are aware of the details of these free trade agreements.
- The majority of respondents have never heard about the Canada-Ukraine Free Trade Agreement (CUFTA) (64%), Canada-Israel Free Trade Agreement (CIFTA) (57%), Modernized Canada-Chile Free Trade Agreement (CCFTA) (54%), and Canada-Korea Free Trade Agreement (CKFTA) (52%).
Few companies use any of these free trade agreements; the exception is NAFTA.
- One-third (33%) of companies currently use the North American Free Trade Agreement (NAFTA) and 22% said their company is planning to start using the agreement in the next year.
- Nine percent of surveyed companies use CETA and 17% are planning to use this agreement, while 7% use CKFTA and 14% are planning to use it. Seven percent of companies are using the Canada-European Free Trade Association Free Trade Agreement and 20% are planning to use the agreement in the next year. Five percent are using CUFTA, CCFTA, and CIFTA.
- The majority of companies are not using and have no plans to use the following free trade agreements: Canada-Honduras Free Trade Agreement (65%), Canada-Jordan Free Trade Agreement (65%), Canada-Colombia Free Trade Agreement (63%), Canada-Peru Free Trade Agreement (60%), Canada-Costa Rica Free Trade Agreement (60%), and Canada-Panama Free Trade Agreement (56%).
-
Topping the list of reasons why companies do not use Canada’s free trade agreements were perceptions that there is no benefit for their company to be derived from using a free trade agreement (34%) and that free trade agreements are difficult to take advantage (30%).
- Among interview participants, the following reasons were offered: free trade agreements do not apply to them (the assumption being that such agreements apply exclusively or mainly to providers of goods or products); their line of business is unaffected by free trade agreements (e.g., photography, publishing, consulting); lack of need; company size (i.e., the perception that free trade agreements are designed for large companies); and lack of information.
Impact of Free Trade Agreements
Tariff reduction is the top perceived benefit of using free trade agreements.
-
Nearly six in 10 (58%) companies that use free trade agreements have benefited from tariff reduction or elimination on goods. Significantly fewer have benefitted from better conditions for exporting services (23%), easier access to government procurement opportunities (20%), greater business stability due to investment clauses in the agreement (17%), and labour mobility clauses/temporary entry (16%).
- When interview participants were asked about the benefits of free trade agreements, there was a noteworthy difference in feedback by the type of exporter. While companies exporting goods could readily identify benefits (e.g., business expansion, client diversification, access to new markets, increased profits, etc.), most service providers said that free trade agreements apply primarily or exclusively to products not services.
- Challenges of free trade agreements were also identified by interview participants: increased competition domestically and internationally, unfair trade practices (e.g., protectionism, corruption), and understanding the terms of the agreements (e.g., which products and services are included, how to settle disputes), among others.
Free trade agreements influence companies’ export strategy in various ways.
- Most respondents said free trade agreements influence their company’s export strategy at least a small amount. Specifically, 14% are influenced a great deal by free trade agreements, 27% a moderate amount, and 33% a small amount.
Communication Preferences and Information Needs
Top information sources for doing business abroad – associations and colleagues.
-
When asked where they get their information and advice on doing business abroad, such as exporting and using free trade agreements, approximately one-third each mentioned industry or business associations (32%) and business associates, colleagues, or partners (32%). Twenty-nine percent use the websites or free online tools of trade promotion organizations.
- Interview participants pointed to the following information needs: market analyses, strategic advice on entering foreign markets, ‘dos and don’ts’ of conducting business in a country or region, information on the political climate in a country or region, advice on risk management, business leads and foreign contacts, and information about international rules, regulations, policies, among others.
- Their main challenges in obtaining this type of information are lack of time, lack of expertise, lack of qualified staff (or resources in general), costs, and getting information in a timely manner,
Vast majority uses the internet to stay on top of industry trends and general business information.
- Just over three-quarters (77%) of respondents said they look to the internet when it comes to staying on top of industry trends and general business information. Following this, 46% use social media.
Reading articles, getting answers from experts – top methods to consume information
- When learning or researching something new, 59% of respondents prefer to read articles and 46% to get answers from an expert.
Notes to Readers
- The report is divided into two sections. The first section presents the results of the online survey (the quantitative component), and the second section presents the results of the in-depth interviews (the qualitative component).
-
Regarding the qualitative results:
- The results provide an indication of participants’ views about the issues explored, but they cannot be generalized to the full population of Canadian SMEs that export.
-
Regarding the quantitative results:
- All results in the report are expressed as percentages, unless otherwise noted. Throughout the report, percentages may not always add to 100% due to rounding.
- In graphs, “DK” stands for “Don’t know” and “NR” for “No response.”
-
Where base sizes are reported in tables and graphs, they reflect the actual number of respondents who answered or were asked the question.
- The number of respondents changes throughout the report because questions were asked of sub-samples of survey respondents. Readers should be aware of this and exercise caution when interpreting results based on smaller numbers of respondents.
-
Subgroup differences are identified in the report. When reporting subgroup variations, only differences that are significant at the 95% confidence level are discussed in the report. If one or more categories in a subgroup are not mentioned in a discussion of subgroup differences, it can be assumed that significant differences were found only among the categories reported.
- When reporting differences by business size, a micro-firm is a firm that has fewer than 5 employees, a small firm has 5-99 employees, a medium firm has 100-499 employees, and a large firm has 500+ employees.
- The results are reflective of Canadian SMEs that export, but they cannot be considered representative of the target population because random sampling was not used. When non-probability sampling is used, the extent to which the survey sample represents the target population is not known (because probability theory cannot be applied).
- The tabulated data is available under separate cover and the research instruments can be found in the appendix.
The contract value was $132,465.95 (including HST).
Political Neutrality Certification
I hereby certify as a Senior Officer of Phoenix Strategic Perspectives that the deliverables fully comply with the Government of Canada political neutrality requirements outlined in the Communications Policy of the Government of Canada and Procedures for Planning and Contracting Public Opinion Research. Specifically, the deliverables do not contain any reference to electoral voting intentions, political party preferences, standings with the electorate, or ratings of the performance of a political party or its leader.
Signed:
Alethea Woods, President
Phoenix Strategic Perspectives Inc.
Detailed Findings
Phase 1: Online Survey
I. Corporate Profile
This section presents the characteristics of survey participants and their businesses.
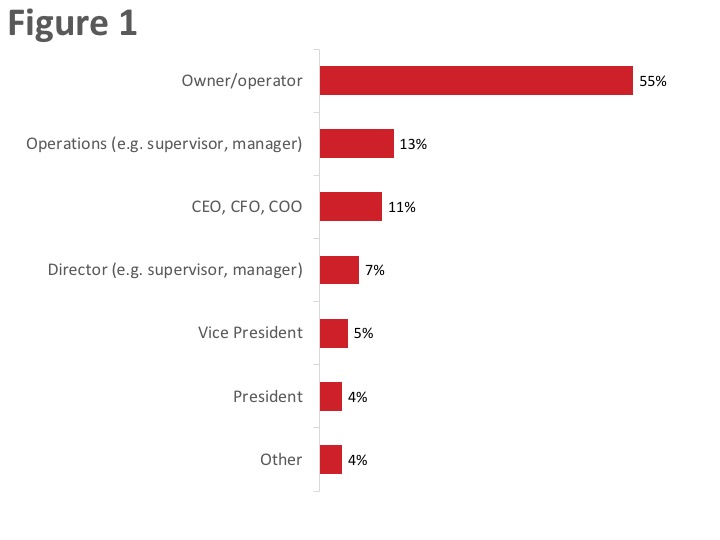
Majority of respondents are owners
Fifty-five percent of respondents are owners. The rest are managers or supervisors in operations (13%), c-level executives (11%), directors (7%), vice presidents (5%), or presidents (4%) of their company.
Figure 1: Role of respondents
Text Description - Figure 1
Base: n=507; all respondents / S3. Which title best describes your role within the company?
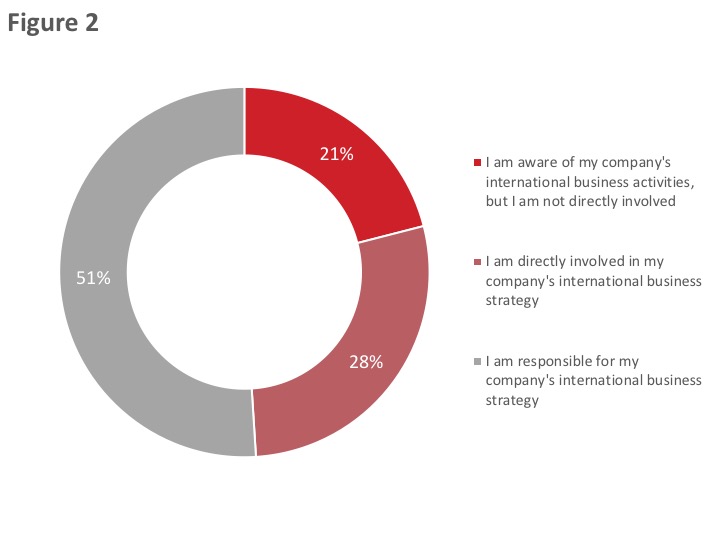
Most are responsible for or directly involved in their company’s international business activities
Half (51%) of those surveyed said they are responsible for their company’s international business strategy. Twenty-eight percent are not responsible, but they are directly involved in their company’s strategy. One in five (21%) are aware of their company’s activities but are not directly involved in such activities.
Figure 2: Familiarity with Company’s International Business Activities
Text Description - Figure 2
Base: n=507; all respondents / S4. How familiar are you with your company’s international business activities?
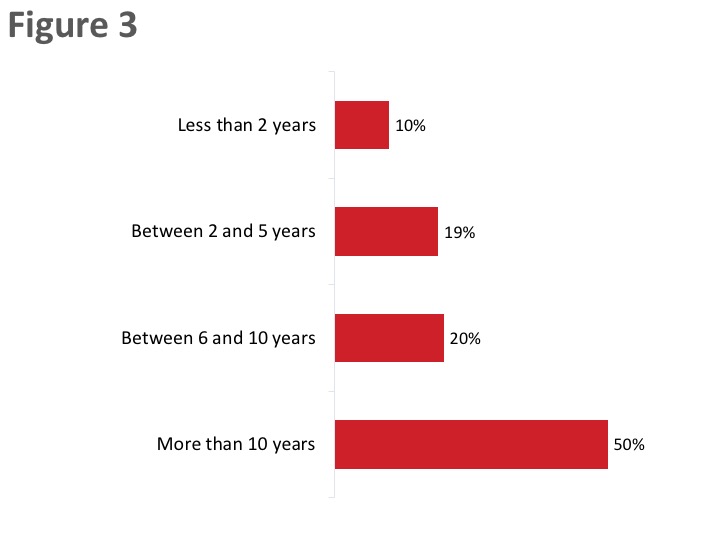
Most work for firms that are established exporters
Half (50%) the respondents said their company has been exporting goods or services internationally for more than 10 years. An additional 20% work for firms that have been exporting for six to 10 years. In total, therefore, 70% of those surveyed work for firms that have been exporting for at least six years. Approximately one in five (19%) said their firm has been exporting for two to five years, while 10% have been exporting for less than two years.
Figure 3: Length of Time Exporting
Text Description - Figure 3
Base: n=507; all respondents. [Dk/nr: 4%; n=17 removed] / A3. For how many years has your company been exporting goods or services internationally?
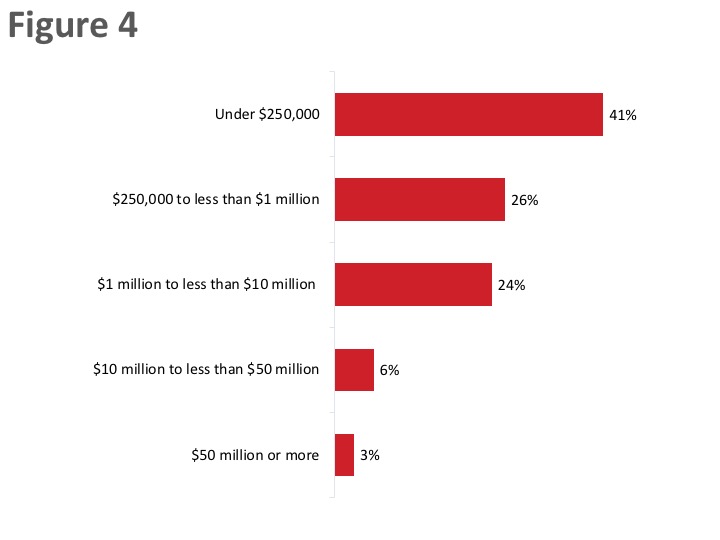
Company Revenues
Respondents were asked to identify their company’s total revenues in their last fiscal year. Two-thirds reported revenues under $1 million: 41% said their firm earned under $250,000 and 26% earned $250,000 to just under $1 million. Conversely, one-quarter (24%) had revenues between $1 million and just under $10 million, while 9% earned $10 million or more in their last fiscal year.
Figure 4: Company Revenues
Text Description - Figure 4
Base: n=507; all respondents. [Dk/nr: 13%; n=57 removed] / A2.In your last fiscal year, what were your company’s total revenues?
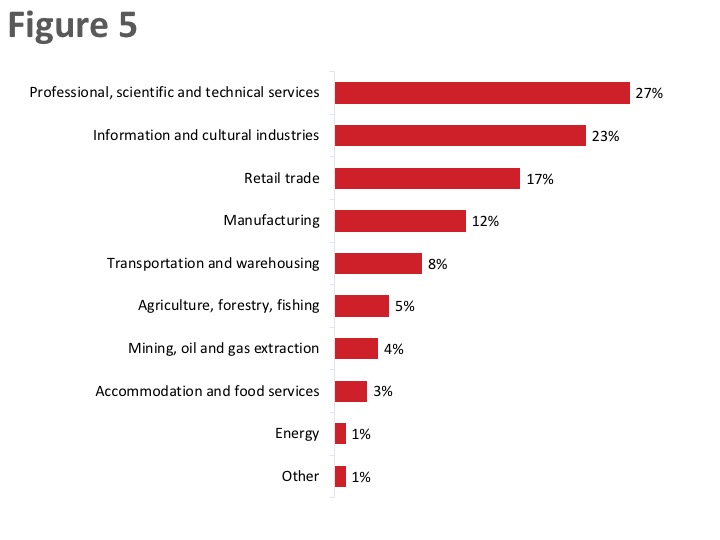
Industry/Sector
When asked to identify the main sector in which their company operates, the greatest single proportion of respondents (27%) said their firm operates in professional, scientific and technical services, followed by information and cultural industries (23%) and retail trade (17%). [1]
Figure 5: Industry/sector
Text Description - Figure 5
Base: n=507; all respondents. / A1. In which industry or sector does your company operate?
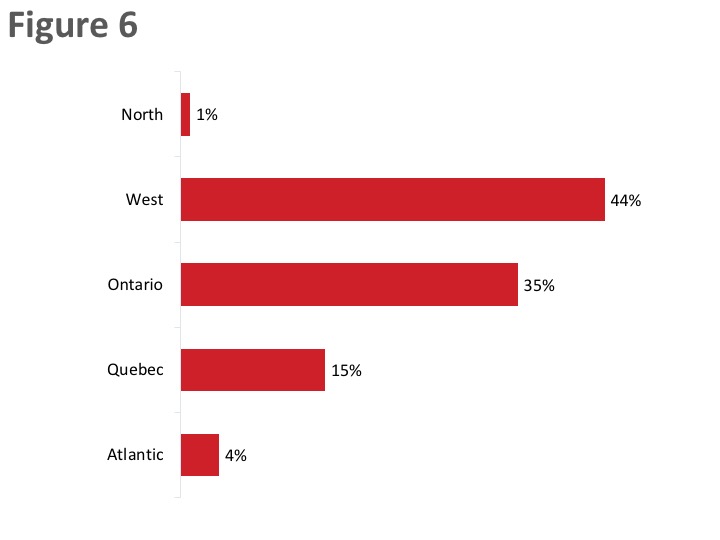
Company Headquarters
The largest proportion of companies are located in the West (44%), followed by Ontario (35%).
Figure 6: Headquarter Location
Text Description - Figure 6
Base: n=507; all respondents / S6. In which province or territory is your company’s headquarters located?
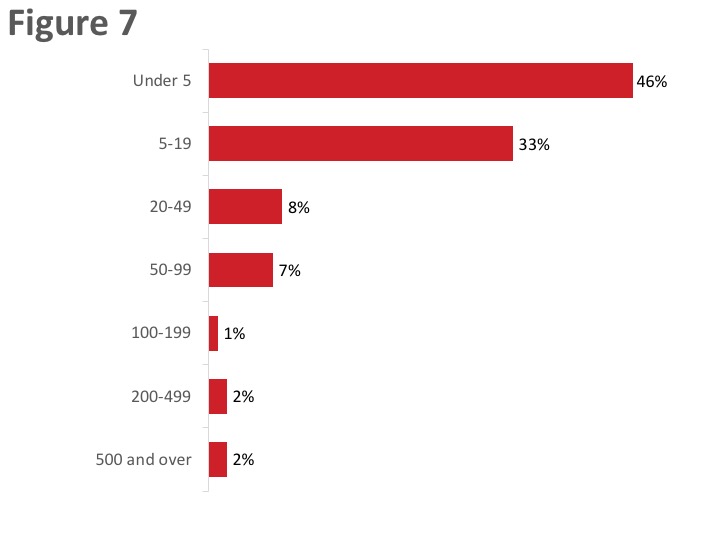
Number of Employees
Per the research design, virtually all respondents represented small or medium-sized Canadian companies.[2]
Figure 7: Number of employees
Text Description - Figure 7
Base: n=507; all respondents / S2. How many employees work for your company?
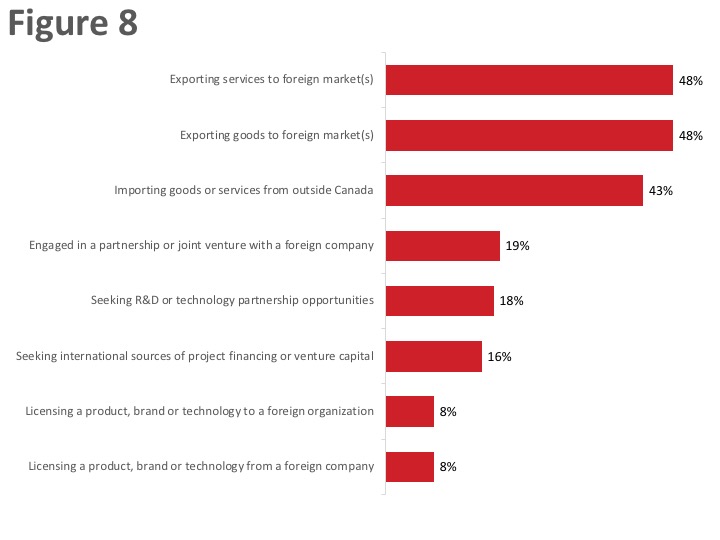
Companies more likely to export and import than be engaged in/looking for partnership or licensing opportunities
Survey respondents work in firms that are involved in international trade and investment in a variety of ways.
Figure 8: Company Trade Activities
Text Description - Figure 8
Base: n=507; all respondents. / S1. Is your company currently engaged in any of the following activities? (multiple responses accepted).
II. Exporting Profile
This section presents information about the exporting activities of surveyed companies.
Majority exports to the U.S. and other foreign markets
More than half (59%) the companies surveyed export to the United States (U.S.) and other foreign markets. In contrast, approximately three in ten (29%) export only to the U.S. and 12% to foreign markets excluding the United States.
Figure 9: Export Markets
Text Description - Figure 9
Base: n=507; all respondents. [Dk/nr: 4%; n=19 removed] / B1. Does your organization export goods and services…?
The likelihood of exporting only to the U.S. was higher among small companies (35%) compared to micro-firms (24%).
North America, followed by Europe and Asia/Pacific are the top export destinations
Among companies that export goods or services (n=348), North America (71%) is the top destination, followed by Europe (67%) and the Asia-Pacific region (55%). Fewer companies currently export to countries in Central or South America (27%) and to the Middle East or Africa (22%).
Figure 10: Current Export Markets
Text Description - Figure 10
Base: n=348; respondents who export goods and services to the US and foreign markets. [Dk/nr: 4%; n=15 removed] / B2. Which markets does your company currently export to? (multiple responses accepted).
The likelihood of exporting to North America was higher among small companies (77%) compared to micro-firms (65%), companies exporting goods (79%) compared to those exporting services (63%), companies that have been exporting for more than 10 years (75%) compared to companies that have been exporting for five or fewer years (61%), and companies active in the information and cultural industries sector (87%) compared those active in retail trades (62%) and professional, scientific and technical services (61%).
Companies exporting goods and services (83%) were more likely than companies exporting only services ( 60%) to export to countries in Europe. The same applied to companies aware of the Trade Commissioner Service (TCS): 82% of those aware of the TCS currently export to Europe compared to 60% of companies not aware of TCS.
The likelihood of exporting to countries in Asia and the Pacific was higher among companies that export goods only (67%) and goods and services (79%) compared to those that export only services (42%).
Top North American destination is the U.S.
The United States is the top export destination among companies that currently export to North America. Virtually everyone (97%) said their company exports to the U.S., while only one-quarter (24%) mentioned Mexico.
Figure 11: Current Export Markets: North America
Text Description - Figure 11
Base: n=240; respondents who export to North America. / B2. Which markets does your company currently export to? (multiple responses accepted).
United Kingdom, France and Germany are the top European export destinations
The United Kingdom (55%), followed by France (41%), and Germany (38%) are the top destinations among companies that currently export to Europe. As the graph depicts, smaller proportions of companies currently export to a variety of other European countries.
Figure 12: Current Export Markets: Top European Destinations
Text Description - Figure 12
Base: n=234; respondents who export to Europe. / B2. Which markets does your company currently export to? (multiple responses accepted).
In addition, countries mentioned by fewer than one in 10 respondents include:
- Hungary (9%) and Poland (9%);
- Norway (8%);
- Luxembourg (7%), Czech Republic (7%), and Turkey (7%);
- Iceland (6%);
- Kazakhstan (5%), Romania (5%), and Ukraine (5%);
- Estonia (4%), Latvia (4%), Bulgaria (4%), Croatia (4%), Slovak Republic (4%) and Lithuania (4%); and
- Malta (3%), Cyprus (3%), Serbia (3%), and Slovenia (3%).
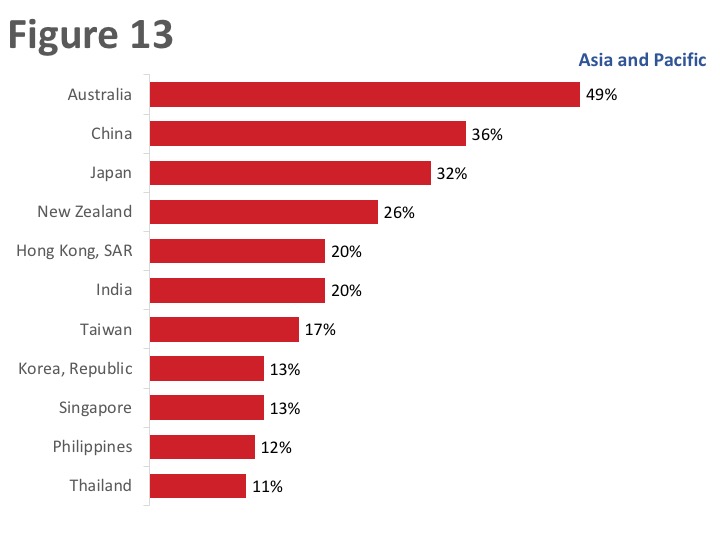
Australia is the top export destinations in Asia and the Pacific
Almost half (49%) the companies surveyed currently export to Australia. Following Australia are China (36%), Japan (32%), New Zealand (26%), Hong Kong (20%), India (20%) and Taiwan (17%). As the graph depicts, smaller proportions of companies export to a variety of other countries in Asia and the Pacific.
Figure 13: Current Export Markets: Top Asia and Pacific Destinations
Text Description - Figure 13
Base: n=195; respondents who export to Asia and the Pacific. / B2. Which markets does your company currently export to? (multiple responses accepted).
In addition, countries mentioned by fewer than one in 10 respondents include:
- 7% export to Pakistan;
- 6% export to each of Indonesia, Malaysia, Vietnam;
- 5% export to each of Bangladesh and Mongolia;
- 4% export to each of Afghanistan and Sri Lanka;
- 3% export to each of Brunei Darussalam and Myanmar; and
- 2% export to each of Cambodia and Laos.
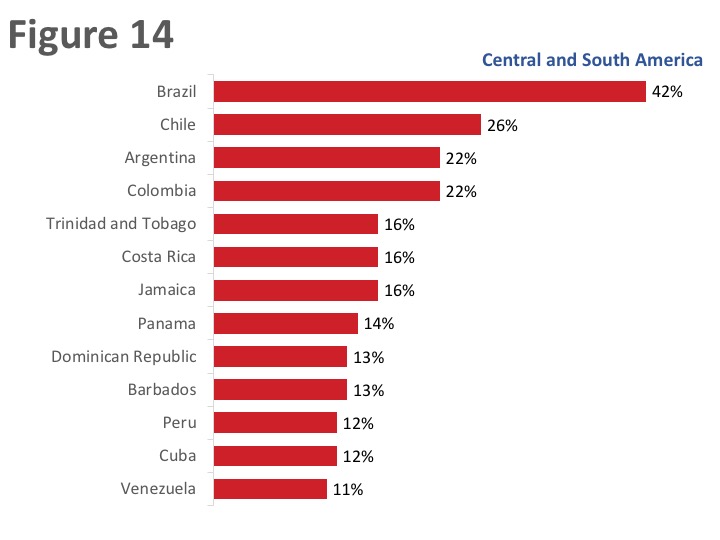
Brazil is the top export destination in Central and South America
Four in 10 (42%) respondents said their company currently exports to Brazil, while 26% export to Chile, 22% to Argentina, and 22% to Colombia. Following this, 16% export to each of Trinidad and Tobago, Costa Rica, and Jamaica. As the graph depicts, smaller proportions of companies export to a variety of other countries in Central and South America.
Figure 14: Current Export Markets: Top Central and South American Destinations
Text Description - Figure 14
Base: n=97; respondents who export to Central and South America. / B2. Which markets does your company currently export to? (multiple responses accepted).
In addition, countries mentioned by fewer than one in 10 respondents include:
- Haiti (9%), Guyana (9%);
- Uruguay (8%), Ecuador (8%);
- Guatemala (7%); and
- Paraguay (6%), El Salvador (6%).
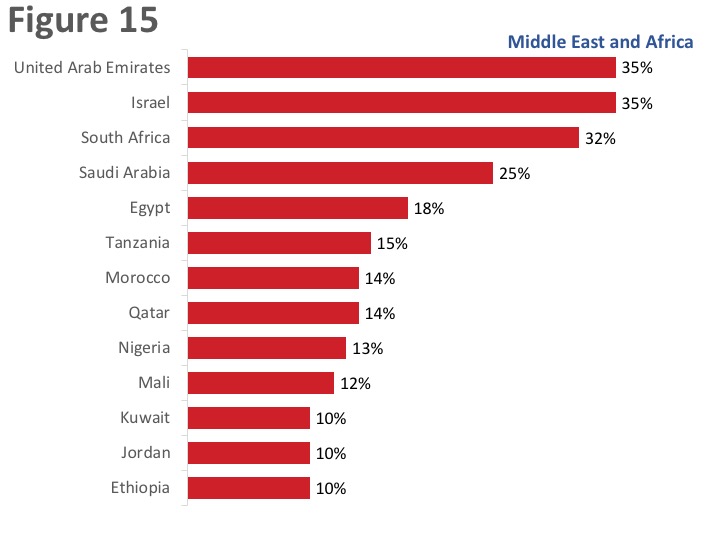
UAE, Israel, and South Africa are top export destinations in Middle East and Africa
Similar proportions said their company currently exports to the United Arab Emirates (UAE) (36%), Israel (35%), and South Africa (32%). Exactly one-quarter (25%) exports to Saudi Arabia and 18% to Egypt. As the graph depicts, smaller proportions of companies export to a variety of other countries in the Middle East and Africa.
Figure 15: Current Export Markets: Top Middle Eastern and African Destinations
Text Description - Figure 15
Base: n=85; respondents who export to the Middle East and Africa. / B3.Which markets, if any, is your company thinking about, or interested in, exporting to? (multiple responses accepted).
In addition, countries mentioned by fewer than one in 10 respondents include:
- Libya (8%), Congo (8%), Sudan (8%), Lebanon (8%), Mozambique (8%);
- Rwanda (7%), Cameroon (7%), Zimbabwe (7%), Cote d'Ivoire (7%);
- West Bank and Gaza Strip (6%), Zambia (6%), Burkina Faso (6%), Senegal (6%); and
- Algeria (5%), Tunisia (5%).
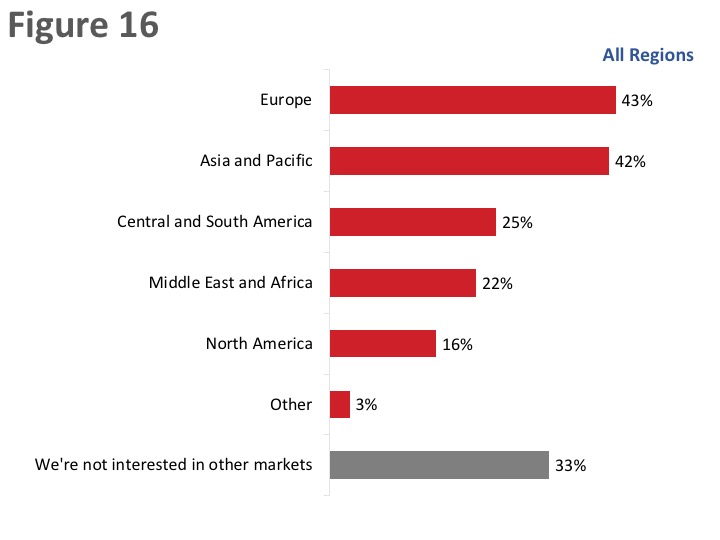
Countries in Europe, Asia and the Pacific are top future destinations of exporters
Asked which markets, if any, their company is thinking about, or interested in, exporting to similar proportions mentioned Europe (43%) and the Asia-Pacific region (42%). Fewer companies are planning to export to countries in Central or South America (25%), the Middle East or Africa (22%), and North America (16%).
One-third of companies are not interested in any other markets at this time.
Figure 16: Future Export Markets
Text Description - Figure 16
Base: n=296; respondents who export goods and services to the US and foreign markets. [Dk/nr: 19%; n=56 removed] / B3. Which markets, if any, is your company thinking about, or interested in, exporting to? (multiple responses accepted).
The top countries identified by respondents as potential export destinations were Australia (20%), followed by New Zealand (15%) and the United Kingdom (14%).
Figure 17: Future Export Markets: Countries
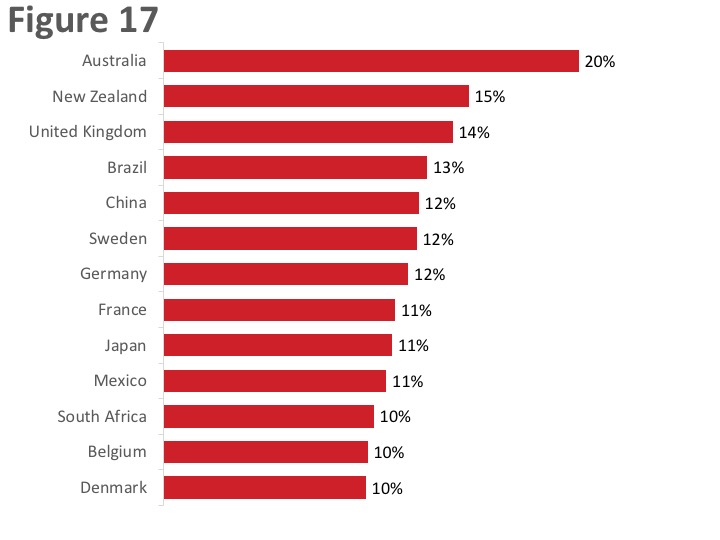
Text Description - Figure 17
Base: n=296; respondents who export goods and services to the US and foreign markets. [Dk/nr: 19%; n=56 removed] / B3.Which markets, if any, is your company thinking about, or interested in, exporting to? (multiple responses accepted).
III. Exporting Obstacles and Assistance
This section presents information about the exporting obstacles encountered by Canadian SMEs, as well as the types of assistance companies would like to help them develop business in markets outside of Canada.
Value of the Canadian dollar is the top challenge experienced by companies
Nearly seven in 10 (69%) reported that the value of the Canadian dollar is at least a minor obstacle to their company’s activities in international markets, including almost half who said it is a moderate (26%) or major (21%) obstacle. At least six in 10 indicated that uncertainty of the regulatory requirements in other countries (67%), lack of market contacts (64%), foreign tariffs and trade barriers (63%), and lack of information on business opportunities (62%) are obstacles for their company. The proportion of respondents rating these as moderate or major obstacles ranged from a low of 36% for lack of information on business opportunities to a high of 39% for tariffs and trade barriers.
In addition, half or more said that linguistic or cultural obstacles (57%), lack of access to financing and funding (53%), and Canadian export taxes or permits (53%) are at least minor challenges for their company when it comes to their company’s activities in international markets.
In contrast, the majority of those surveyed indicated that the following are not challenges faced by their company: corruption (52%), patent/IP concerns (52%), discriminatory treatment of Canadian investors (51%), and labour availability and skills (50%). Respondents who said these issues are challenges for their company were more likely to rate them as minor or moderate obstacles not major obstacles.
Figure 18: Obstacles to Activities in International Markets
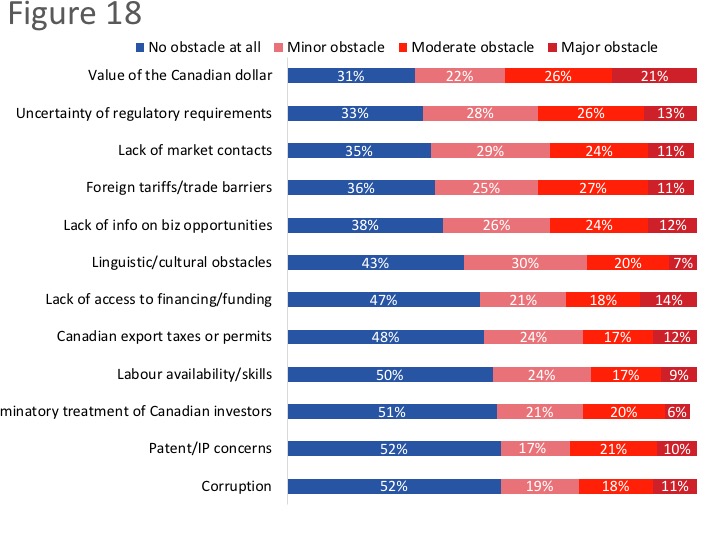
Text Description - Figure 18
Base: n=507; all respondents. [Dk/nr: 6%-12%; n= 30-56 removed]. / C2. How large of an obstacle, if at all, are each of the following issues to your company’s activities in international markets?
The value of the Canadian dollar was more likely to be an obstacle for companies planning to export to the Ukraine (90%) than to Mexico or the U.S. (63%). Canadian export taxes or permits were more likely to be an obstacle for companies planning to export to the Ukraine (86%) than to CETA countries (56%). Discriminatory treatment of Canadian investors was more likely to be an obstacle for companies planning to export to the Ukraine (87%) than to Mexico or the U.S. (53%) and CETA countries (52%)[3].
Compared to micro-sized firms (under 5 employees), small companies (5 to 99 employees) were more likely to identify the following as obstacles: the value of the Canadian dollar (74% versus 63%); Canadian export taxes or permits (60% versus 43%); discriminatory/arbitrary treatment of Canadian investors or their investments (54% versus 35%); lack of access to financing or funding (57% versus 46%); foreign tariffs or trade barriers (72% versus 53%); linguistic or cultural obstacles (64% versus 48%); and labour availability and skills (59% versus 37%).
Majority of exporters require at least a little assistance in many areas
Respondents were asked how much assistance, if any, their company needs in the following areas when developing business in markets outside of Canada:
- Market intelligence and information
- Referrals to legal professionals, human resource professionals, translators and other professional service providers
- Support for the protection of intellectual property rights, government procurement and/or regulatory matters
- Referrals to international business opportunities/sales leads
- Referrals of technology and/or R&D partnership opportunities
- Referrals to other relevant commercial programs and services
- Information or advice on locating financial/funding assistance
- Recommendations on trade fairs/trade missions to attend
- Practical advice on timing and organizing your business trip
- Information about organizations or companies in foreign markets
- Understanding responsible business practices in foreign markets.
Areas in which respondents were more likely to say their company requires some or a great deal of assistance include market intelligence and information (48%), referrals to international sales leads (47%), understanding business practices in foreign markets (45%), and information about companies in foreign markets (43%).
Areas in which companies are less likely to require assistance are referrals of technology and/or R&D partnership opportunities (47% of companies require no assistance), information or advice on locating financial/funding assistance financial advice (45% require no assistance), and practical advice on timing and organizing your business trip (44% require no assistance).
Figure 19: Assistance Required to Develop Foreign Markets
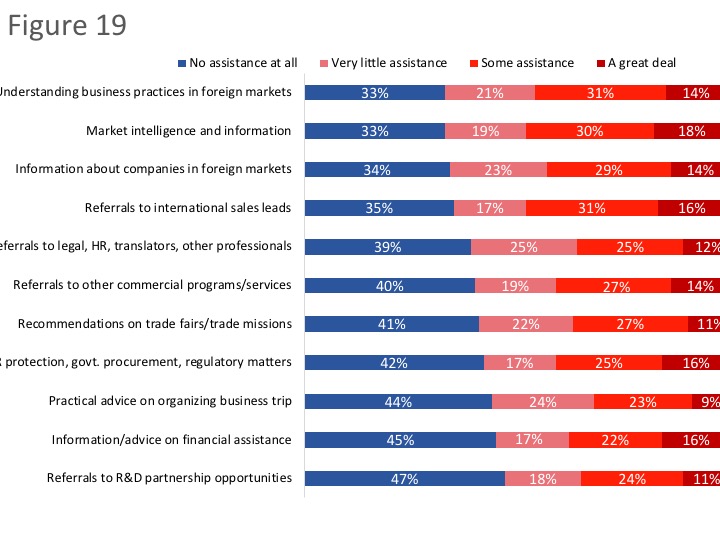
Text Description - Figure 19
Base: n= 507; all respondents. [Dk/nr: 6%-9%; n=28-41 removed] / C1. How much assistance, if any, does your company need in the following areas when developing business in markets outside of Canada?
Companies headquartered in western Canada were more likely to not need assistance in many of these areas, including: market intelligence and information; protection of IPR, government procurement and regulatory matters; referrals to international business opportunities/sales leads; referrals to other relevant commercial programs and services; information or advice on locating financial assistance; information about organizations or companies in foreign markets; and understanding responsible business practices in foreign markets.
Micro- and small-sized companies were more likely than medium-sized companies to not need any assistance in these areas.
Compared to companies not planning to export to a country with which Canada has a free trade agreement, companies planning to export to a free trade agreement country were more likely to require assistance in all these areas.
IV. Awareness and Use of Free Trade Agreements
This section presents findings on respondents’ awareness and company use of free trade agreements. At this point in the online questionnaire, respondents were presented with the following information:
Free trade agreements are negotiated to reduce trade barriers, such as import quotas and tariffs, and to increase the trade of goods and services among the participating countries.
Uneven awareness of free trade agreements
Half or more of respondents have never heard about the following free trade agreements: Canada-Ukraine Free Trade Agreement (CUFTA) (64%), Canada-Israel Free Trade Agreement (CIFTA) (57%), Modernized Canada-Chile Free Trade Agreement (CCFTA) (54%), and Canada-Korea Free Trade Agreement (CKFTA) (52%). Those who claim some awareness of these free trade agreements were more likely to know them by name only (i.e., “heard about it but do not know any details”). Relatively few said they know details about each of these free trade agreements: CUFTA (15%), CIFTA (13%), CCFTA (15%), and CKFTA (14%).
In contrast, there was relatively widespread awareness of the Comprehensive and Progressive Trans-Pacific Partnership (CPTPP) and the Canada-European Union Comprehensive Economic and Trade Agreement (CETA). Seventy-four percent have at least heard about CETA and 72% have at least heard about CPTPP. That said, only 7% of respondents said they are aware of the details of these free trade agreements.
Figure 20: Awareness of Free Trade Agreements
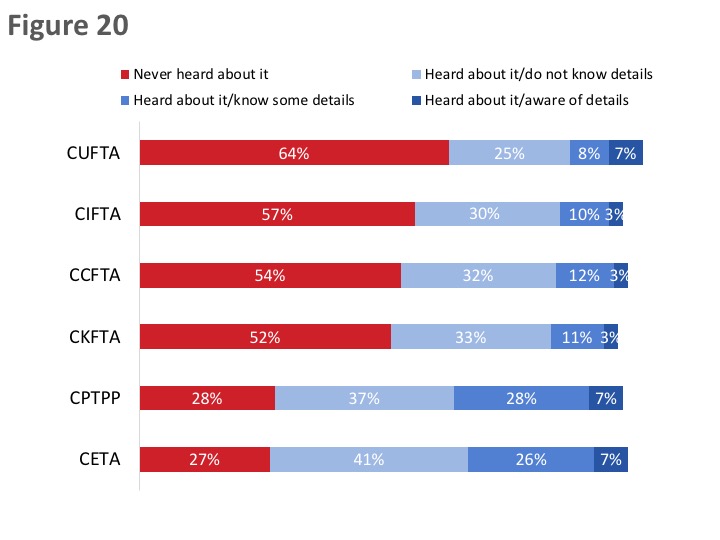
Text Description - Figure 20
Base: n=507; all respondents. / D1. How familiar are you with the following free-trade agreements?
Awareness of all these free trade agreements was higher among medium-sized companies than micro or small companies, and among companies aware of the TCS. In addition, awareness of CKFTA was higher among companies planning to export to a country with which Canada has a free trade agreement (57% versus 42% of those not)
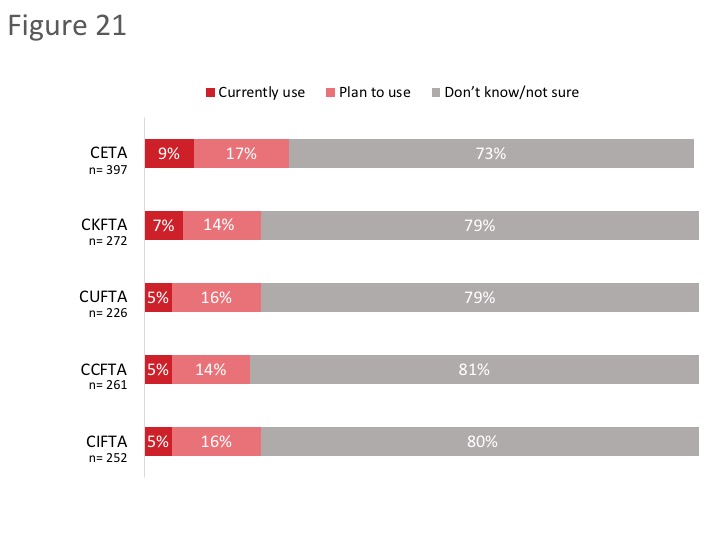
Few companies use any of these free trade agreements
Few companies aware of these free trade agreements are using any of the agreements. Nine percent use CETA and 17% are planning to use this agreement, while 7% use CKFTA and 14% are planning to use the agreement. Five percent of exporting companies aware are using CUFTA, CCFTA, and CIFTA.
Figure 21: Use of Free Trade Agreements
Text Description - Figure 21
Base: those familiar with the FTAs / D2. Does your company currently use or plan to use in the next year any of the following free trade agreements?
Micro-sized companies were less likely than medium-sized companies to be planning to use any of these free trade agreements.
Before being asked about their company’s use of these free trade agreements, respondents were provided with several examples of how their company may be using a free trade agreement. These included:
- claiming preferential tariff treatment for a product their company exports, benefiting from the reduction or elimination of a tariff;
- claiming preferential tariff treatment for an imported product, reducing the cost of their business inputs;
- taking advantage of temporary entry provisions included in an agreement that have facilitated company entry and work authorization in the other country;
- taking advantage of new or enhanced access to government procurement opportunities in a free trade agreement partner country;
- doing business in a free trade agreement partner country in a services sector that has benefitted from improved market access commitments thanks to a free trade agreement; or
- investing in a country with which Canada has a free trade agreement, if the Agreement’s new investment protections influenced the company’s decision to make the investment.
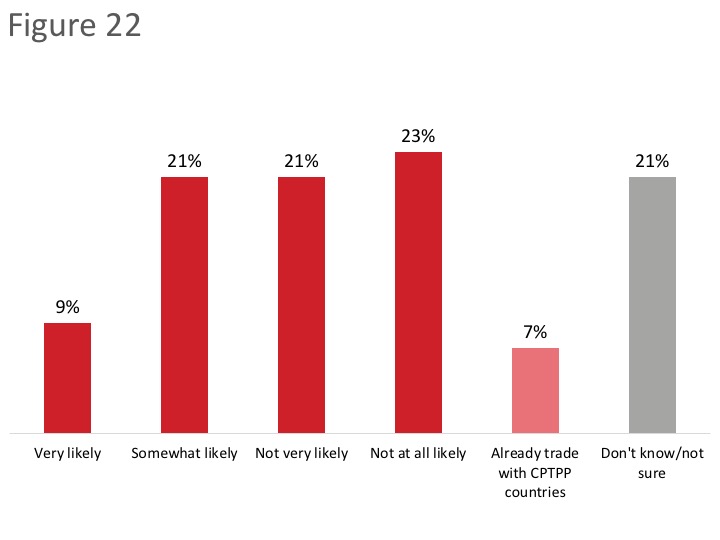
Three in 10 are at least somewhat likely to start trading with CPTPP countries
When asked how likely it is that their company will start to trade with CPTPP countries as a result of this free trade agreement, three in 10 respondents said it is somewhat (21%) or very (9%) likely. Conversely, 21% said it is not very likely and 23% that it is not at all likely that their company will start trading with CPTPP countries. The rest were uncertain (21%) about their company’s plans or indicated that their company already trades with CPTPP countries.
Figure 22: Likelihood of Trading with CPTPP Countries
Text Description - Figure 22
Base: n=507, all respondents. / D3. How likely is it that your company will start to trade with CPTPP countries as a result of this free trade agreement?
Small and medium-sized companies are more likely than micro-sized companies to start to trade with CPTPP countries as a result of this free trade agreement.
Before being asked about their company’s use of the CPTPP, respondents were provided with the following information about the agreements:
The Comprehensive and Progressive Agreement for Trans-Pacific Partnership (CPTPP) is a free trade agreement between Canada and 10 other countries in the Asia-Pacific region: Australia, Brunei, Chile, Japan, Malaysia, Mexico, New Zealand, Peru, Singapore, and Vietnam. Once the agreement is fully implemented, 99% of all tariff lines will be duty-free. The CPTPP also provides exporters with enhanced access to government procurement opportunities in CPTPP markets, offers greater certainty and stability for investors and companies in the service sectors, and increases labour mobility.
On December 30, 2018 the CPTPP entered into force among the first six countries to ratify the agreement – Canada, Australia, Japan, Mexico, New Zealand, and Singapore. On January 14, 2019, the CPTPP entered into force for Vietnam. Peru, Chile, Malaysia, and Brunei have not yet ratified the Agreement.
Virtually all companies that currently trade with CPTPP countries (n=30)[4] are likely to continue trading with these countries as a result of the trade agreement (88% are very likely and 9% are somewhat likely). The rest (3%) were uncertain about their company’s plans.
Over the next three years, the majority of these respondents (n=30)[5] expect their company’s volume of exports to the Asia-Pacific region will stay about the same (51%). Among those who expect a change, just over one-quarter expect export volumes to increase somewhat (24%) or significantly (3%). One in 10 expect export volumes to decrease somewhat and the rest (12%) do not know what to export in terms of the outlook for export volumes to the Asia-Pacific region.
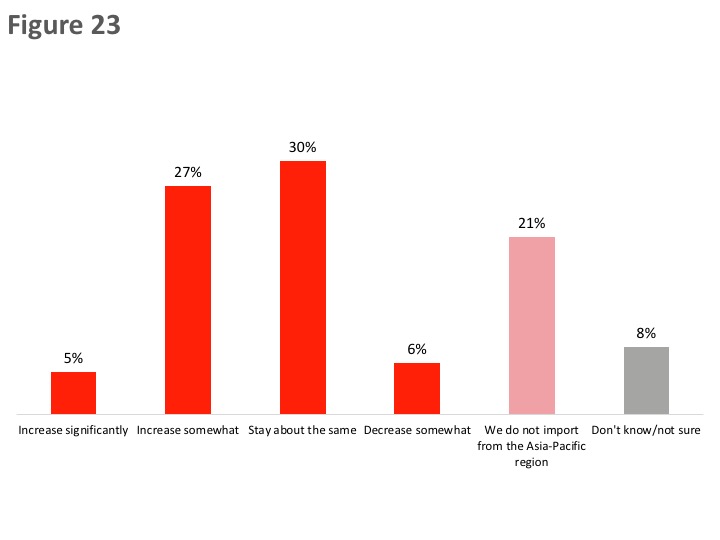
Importers do not expect a decrease in the volume of imports from Asia-Pacific region
Almost one-third (32%) of importers expect the volume of imports from the Asia-Pacific region to increase somewhat (27%) or significantly (5%). Almost as many (30%) export the level of imports to remain the same. Only 6% anticipate a decrease (8% were uncertain about the outlook and 21% do not import from this region).
Figure 23: Outlook for Import Volumes from the Asia-Pacific Region
Text Description - Figure 23
Base: n=215; companies that import / D6. Over the next three years, do you expect the volume of your company’s imports from the Asia-Pacific region will …?
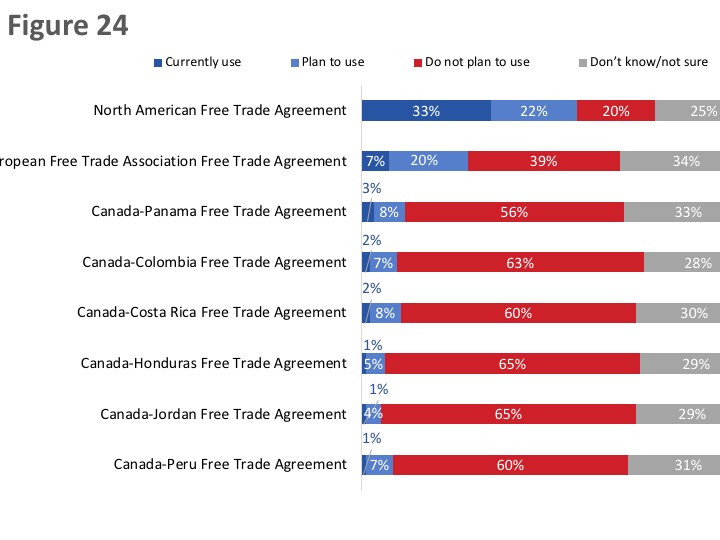
Companies most likely to be using or planning to use NAFTA
One-third (33%) of respondents said their company currently uses the North American Free Trade Agreement (NAFTA) and 22% said their company is planning to start using the agreement in the next year. In total, therefore, 55% of companies are currently or planning to use NAFTA. The rest reported that their company has no plans to use NAFTA (20%) or that they are uncertain of their company’s plan in relation to this trade agreement (25%). Following NAFTA, 7% of companies are using the Canada-European Free Trade Association Free Trade Agreement and 20% are planning to use the agreement in the next year.
The majority of companies are not using and have no plans to use the following free trade agreements: Canada-Honduras Free Trade Agreement (65%), Canada-Jordan Free Trade Agreement (65%), Canada-Colombia Free Trade Agreement (63%), Canada-Peru Free Trade Agreement (60%), Canada-Costa Rica Free Trade Agreement (60%), and Canada-Panama Free Trade Agreement (56%).
Figure 24: Use of other free trade agreements
Text Description - Figure 24
Base: n=507; all respondents. / D7. Which, if any, other free trade agreements does your company currently use or plan to start using in the next year?
Micro- and small-sized companies are more likely than medium-sized companies to not be planning to use any of the free trade agreements. Companies planning to start exporting to countries with which Canada has a free trade agreement were more likely than those that are not to be planning to use one of these free trade agreements.
Limited awareness of specific free trade agreement negotiations or discussions
Three-quarters (75%) of respondents have not heard about the Canada-MERCOSUR free trade agreement negotiations. Those who have are more likely to know these negotiations by name only (16%) than to know some (7%) or all (2%) details. In addition, 60% are not aware of the Canada-ASEAN exploratory discussions. Of those who are aware, 28% have heard about the exploratory discussions, 9% know some details, and 3% are aware of the details of these discussions.
Awareness of the Canada-Pacific Alliance free trade negotiations is somewhat higher, with only 44% of respondents saying they have not heard about these negotiations. Of those who are aware, 37% have heard about the free trade negotiations, 15% know some details, and 4% are aware of the details. In total, therefore, 56% of respondents are aware of the Canada-Pacific Alliance free trade negotiations at least by name.
Figure 25: Awareness of free trade discussions or negotiations
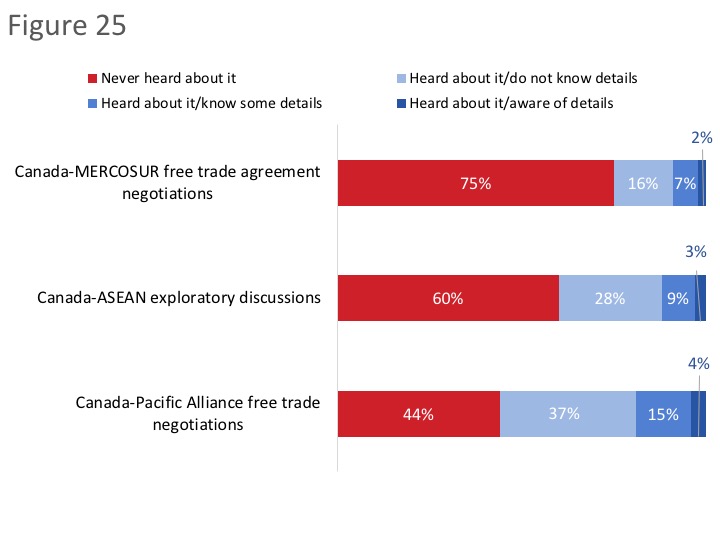
Text Description - Figure 25
Base: n=507; all respondents. / D8. Have you heard anything about the following free trade agreement negotiations or discussions?
Various reasons for not using free trade agreements
Respondents who indicated that their company is not using free trade agreements to export goods or services (n=272) pointed to a variety of reasons to explain why this is the case. Topping the list, however, were the perceptions that there is no benefit for their company to be derived from using a free trade agreement (34%) and that free trade agreements are difficult to take advantage of/to use (30%). Following this, one-quarter (26%) said their company lacks information on free trade agreements and almost one in five (19%) mentioned that their company is not interested in the markets accessible through Canada’s free trade agreements.
Reasons mentioned by approximately one in 10 included lack of awareness of Canada’s free trade agreements (13%) as well as the perceptions that the eligibility requirements are complex (12%) or that the agreements do not apply to the company’s products or services (10%).
As depicted in the graph, a variety of other reasons were offered to explain why their company is not using any of Canada’s free trade agreements by fewer than one in 10 respondents.
Figure 26: Reasons for Not Using Free Trade Agreements
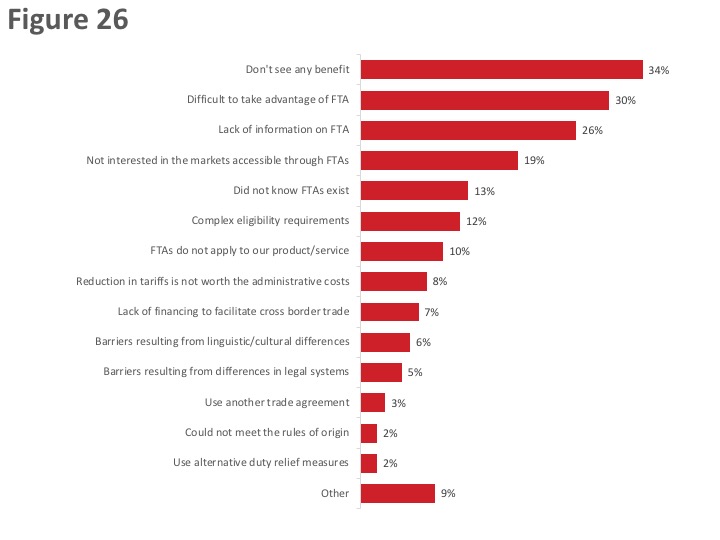
Text Description - Figure 26
Base: n=272; those who do not use FTAs. [Dk/nr: 2%; n=5 removed] / E1. Why is your company not using free trade agreements to export goods or services? (multiple responses accepted).
V. Impact of Free Trade Agreements
This section presents findings on the perceived impact of free trade agreements on Canadian SMEs. These questions were only asked of respondents who indicated that their company uses one or more free trade agreements.
Tariff reduction is the top perceived benefit of using free trade agreements
Nearly six in 10 (58%) companies that use free trade agreements (n=191) have benefited from tariff reduction or elimination on goods. Significantly fewer have benefitted from better conditions for exporting their services (23%), easier access to government procurement opportunities (20%), greater business certainty/stability due to investment clauses in the agreement (17%), and labour mobility clauses/temporary entry (16%).
Figure 27: Benefits of Using Free Trade Agreements
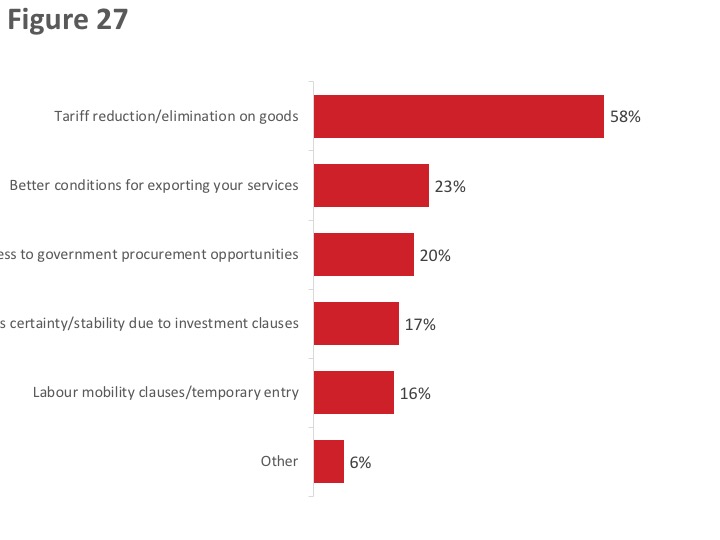
Text Description - Figure 27
Base: n=191; those who use FTAs. [Dk/nr: 9%; n=18 removed] / E2. Thinking about the free trade agreements that your company currently uses, has your company benefited from any of the following? (multiple responses accepted).
Company, followed by the importer are more likely to claim reduced customs duties
Among companies that have benefited from tariff reduction or elimination on goods (n=121), 80% claimed the reduced customs duties under the free trade agreements they use. Alternatively, 76% said this was claimed by the importer of the goods, and 68% by the manufacturer.
Figure 28: Customs Duties
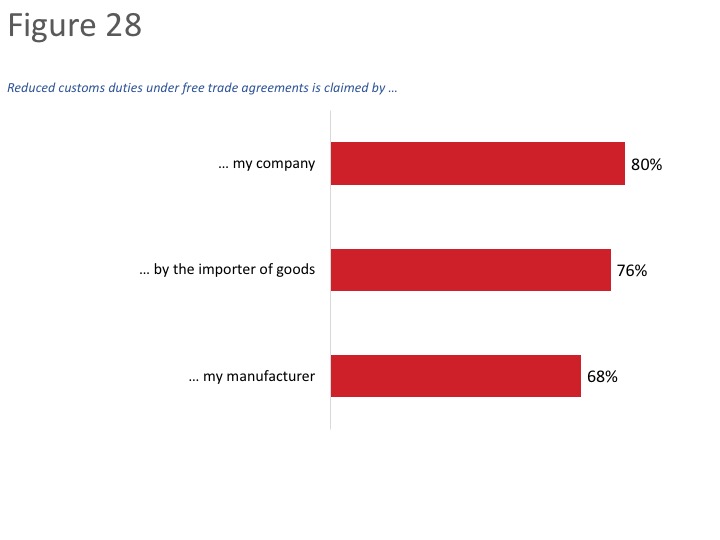
Text Description - Figure 28
Base: n=121; those who benefited from tariff reduction. [Dk/nr: 74%-96%; n=46-48 removed] [Not applicable: 10%-21%; n= 5-11 removed] / E3. Did your company, your manufacturer or the importer of your goods claim reduced customs duties under a free trade agreement?
Various factors influenced companies’ decision to not claim the reduced customs duties
Respondents who indicated that their company did not claim the reduced customs duties (n=52) were asked what impact, if any, a number of factors had on the decision. The factors included:
- The good we export is not covered by the free trade agreement.
- We did not see a significant tariff reduction as a result of the free trade agreement.
- We did not know we needed to apply for a free trade agreement preference.
- We do not understand free trade agreements or the eligibility requirements/rules of origin.
- The delays associated with obtaining Origin Declarations are too long.
- The administrative costs associated with obtaining Origin Declarations are too high.
- We use the tariff preferences available under the World Trade Organization (WTO) because the rules/requirements are simpler.
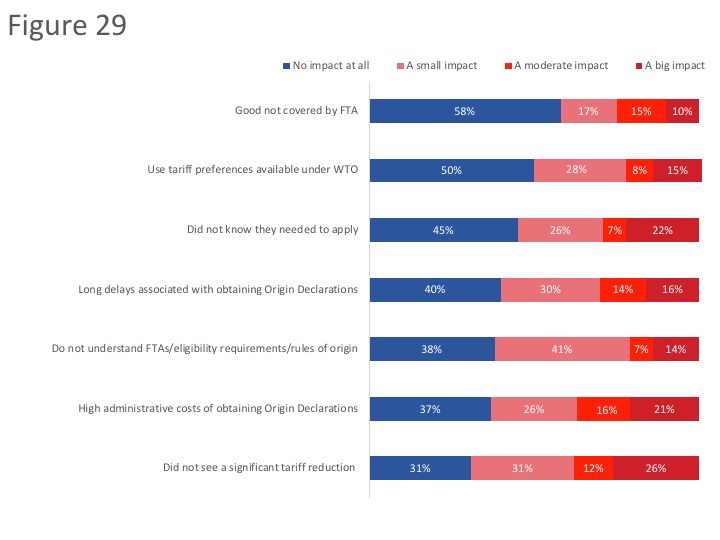
Respondents were more likely to point to the following as factors as having at least a small impact on their company’s decision: not seeing a significant tariff reduction (66% including 26% who said this had a big impact), high administrative costs of obtaining Origin Declarations (63%), lack of understanding of free trade agreements, eligibility requirements or rules of origin (62%), and long delays associated with obtaining Origin Declarations (60%).
The majority of respondents said that their good not being covered by the free trade agreement (58%) and use of tariff preferences available under the WTO (50%) had no impact on their company’s decision to not claim reduced customs duties.
Figure 29: Reasons for Not Claiming Reduced Customs Duties
Text Description - Figure 29
Base: n=52; those who did not claim reduced custom duties. [Dk/nr: 22%-47%; n=9-16 removed] / E4. What impact, if any, did the following factors have on your company’s decision to not claim reduced customs duties for your goods?
Impact of free trade agreements on government procurement not known
Respondents who indicated that their company has benefited from easier access to government procurement opportunities (n=61) were asked to rate their level of agreement or disagreement with the following:
As a result of free trade agreements…
- Our company has better access to information regarding foreign government procurement opportunities.
- Our company is pursuing foreign government procurement contracts in free trade agreement partner countries.
- Our company has been able to more easily apply for foreign government procurement opportunities.
- The foreign government procurement process fairly lets Canadian companies compete against local businesses.
In all cases, the majority of respondents indicated that they did not know what impact free trade agreements have had in these areas.
Various impacts of free trade agreements on labour mobility
Respondents who indicated that their company has benefited from labour mobility or temporary entry clauses (n=47) were most likely to agree that their company’s management and personnel have more capacity to work in free trade agreement markets (66%) as a result of free trade agreements. In addition, more than half agreed that their company’s management and personnel have more capacity to access opportunities as contractors in free trade agreement markets (57%) and have sent staff to free trade agreement markets (55%). Respondents were less likely to report that their company has increased the number of business trips taken to free trade agreement markets (44%).
Figure 30: Impact of free trade agreements on labour mobility
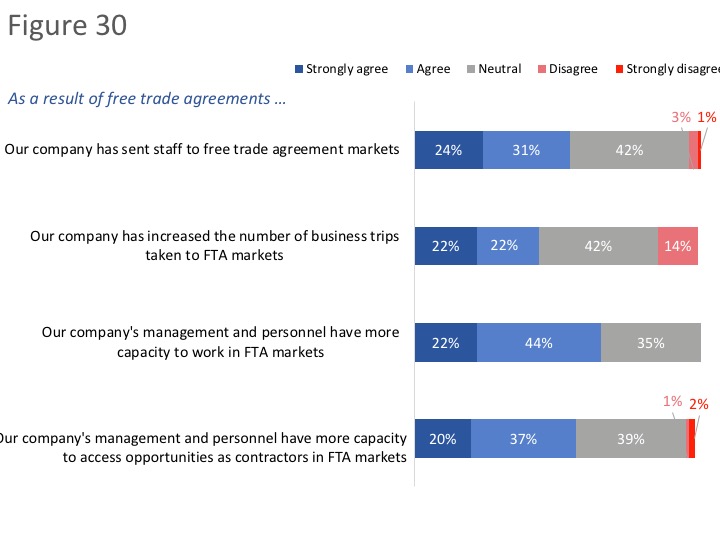
Text Description - Figure 30
Base: n=47; those who used labour mobility or temporary entry clauses. [Dk/nr: 37%-45%; n=10-12 removed] / E6. How much do you agree or disagree with the following statements?
Free trade agreements have modest impact on business practices
Those who said their company uses free trade agreements (n=191) were asked about the impact of these agreements on their company’s business practices.
Nearly four in 10 (39%) agreed that free trade agreements have improved their company’s supply chain arrangements or integration, while 22% disagreed. The rest (39%) were neutral, neither agreeing nor disagreeing that their company has improved supply change arrangements or integration.
Following this, 35% agreed that their company has improved contractual arrangements with buys, and 33% that their company has changed administrative practices to build FTA-related processes. Those who did not agree were more likely to be neutral than to express disagreement.
Figure 31: Impact of free trade agreements on business practices
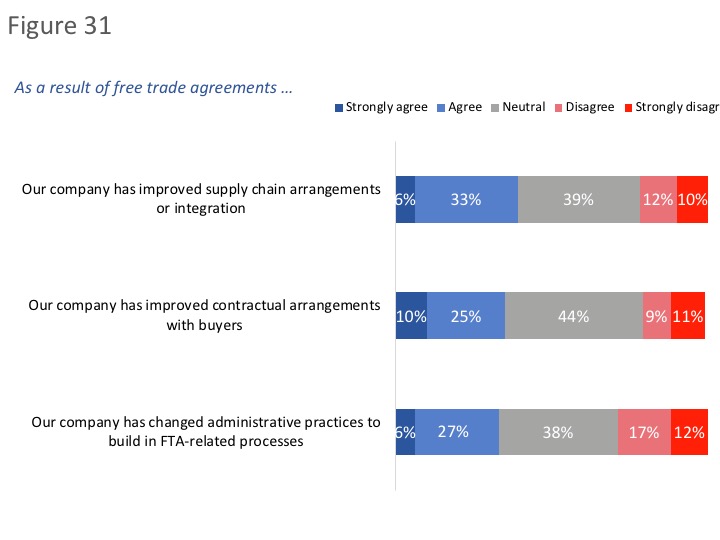
Text Description - Figure 31
Base: n=191; those who used FTAs. [Dk/nr: 37%-45%; n=10-12 removed] / E7. How much do you agree or disagree with the following statements?
Free trade agreements influence companies’ export strategy in various ways
Most respondents said free trade agreements influence their company’s export strategy at least a small amount. Specifically, 14% are influenced a great deal by free trade agreements, 27% a moderate amount, and 33% a small amount. Conversely, the export strategy of one-quarter (26%) of companies is not at all influenced by Canada’s free trade agreements.
Figure 32: Influence of free trade agreements on export strategy
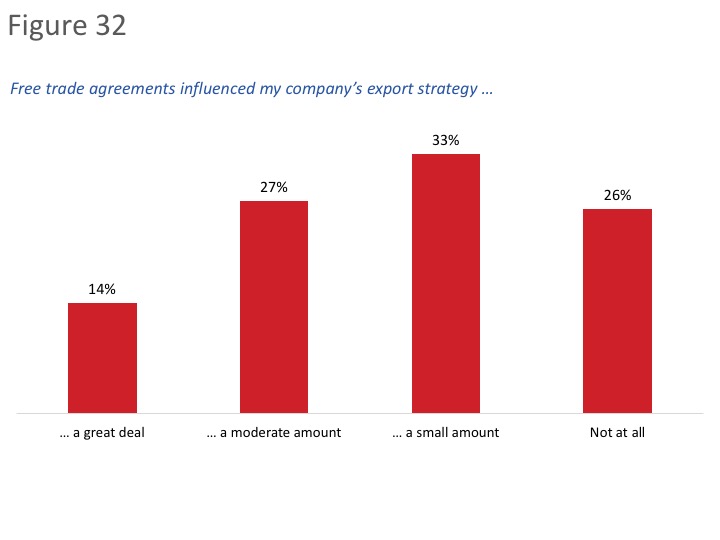
Text Description - Figure 32
Base: n=235; those aware of FTAs. [Dk/nr: 5%; n=9 removed] / E8. How much, if at all, do free trade agreements influence your company’s export strategy and encourage you to consider new markets?
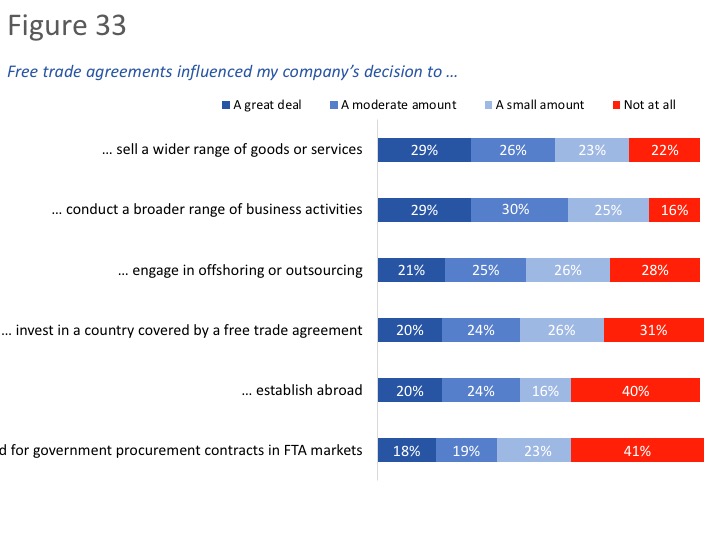
Companies are influenced by free trade agreements in various ways. Most (84%) respondents said that free trade agreements have influenced their company’s decision to conduct a broader range of business activities, including 29% who said it influenced their company a great deal. In addition, nearly eight in 10 (78%) reported that free trade agreements have influenced their company’s decision to sell a wider range of goods or services, while seven in 10 said these agreements encouraged their company to engage in offshoring or outsourcing (72%) or to invest in a country covered by a free trade agreement (70%).
Free trade agreements were less likely to have influenced companies to establish abroad or to bid for government procurement contracts in free trade agreement markets. The plurality (40% and 41%, respectively) reported that free trade agreements did not at all influence their company’s decision to engage in these activities.
Figure 33: Areas in which free trade agreements influenced export strategy
Text Description - Figure 33
Base: n191; those who’s export strategy was influenced by FTAs. [Dk/nr: 4%-8%; n=6-10 removed] [Does not apply: 7%-26%; n=10-30 removed] E9. How much, if at all, have free trade agreements influenced your company’s decision to…?
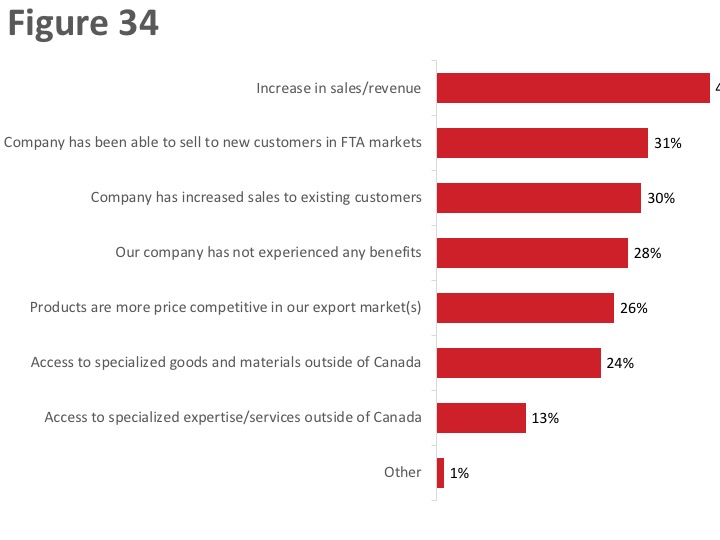
Other benefits of free trade agreements include increased sales and customer acquisition
When asked what other benefits, if any, their company has experience as a result of using free trade agreements, 40% of respondents pointed to increased sales or revenues, 31% to the acquisition of new customers in free trade agreement markets, and 30% to increased sales to existing customers.
In addition, approximately one-quarter mentioned that products are more price competitive of their export markets (26%) and that their company is able to access specialized and goods and materials outside of Canada (24%). Thirteen percent said their company has benefited from access to specialized expertise and services outside of Canada as a result of free trade agreements.
Nearly three in 10 (28%) said their company has not experienced any benefits of free trade agreements.
Figure 34: Other benefits of free trade agreements
Text Description - Figure 34
Base: n=235; those aware of FTAs. [Dk/nr: 1%; n=1 removed] / E10. What other benefits, if any, has your company experienced as a result of using free trade agreements?
VI. Awareness of the Trade Commissioner Service
This section presents findings on respondents’ awareness and perceptions of the Trade Commissioner Service (TCS). These questions were only asked of respondents aware one or more free trade agreement.
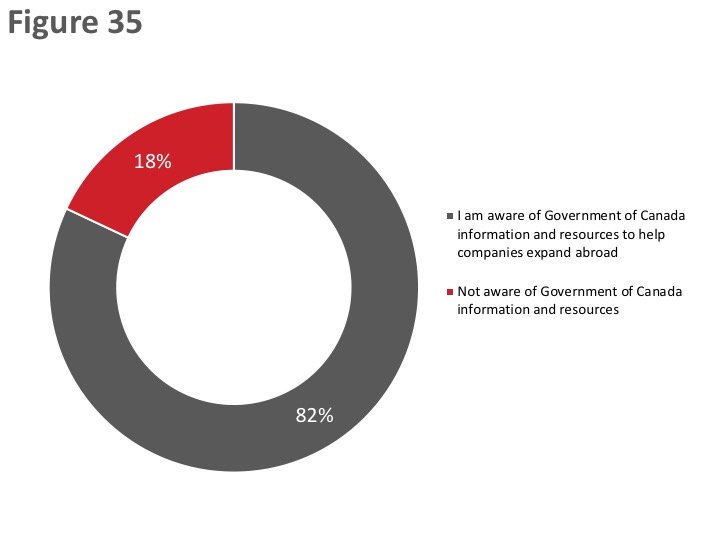
Widespread awareness of Government of Canada information and resources for exporters
Eight in 10 (82%) respondents aware of free trade agreements (n=235) indicated that they are aware that the Government of Canada has information and resource available to help companies their business abroad. Conversely, 18% are not aware.
Figure 35: Awareness of GoC resources and information
Text Description - Figure 35
Base: n=235; those aware of FTAs / F1. Are you aware that the Government of Canada has information and resources available to help companies expand their business abroad?
Awareness that the Government of Canada has information and resources available help companies expand their business abroad was higher among those aware of the TCS (94% versus 69% of those not aware), micro-sized firms (95% versus 74% of small firms and 78% of medium-sized firms) and firms currently exporting to the U.S. and foreign markets (86% versus 70% of those exporting only to the U.S.),
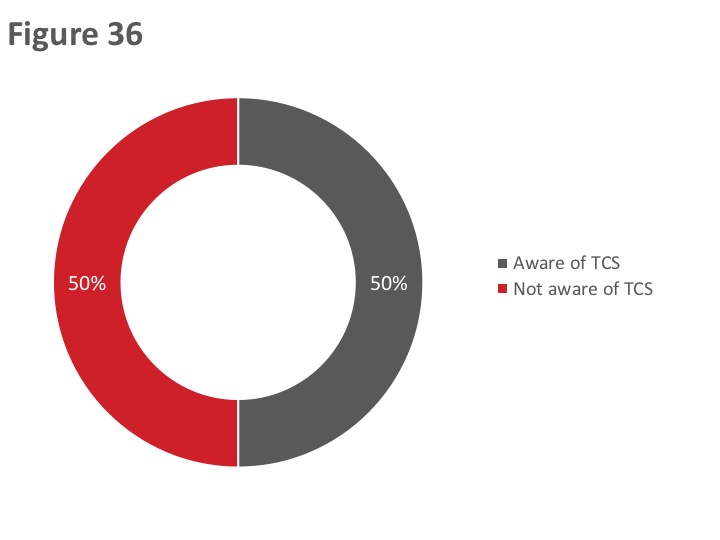
Half aware of the TCS; most of those aware know of the TCS by name only
Exactly half (50%) of those aware of free trade agreements have heard of the Trade Commissioner Service, or TCS.[6] Those aware of the TCS (n=115) were asked what, if anything, they have heard about it. Most (83%) acknowledged that they had heard of the TCS, but that they could not recall anything specific about the TCS. Beyond this, 13% had heard that the TCS provides trade assistance.
Figure 36: Awareness of TCS
Text Description - Figure 36
Base: n=235; those aware of FTAs / F2. Have you ever heard of the Trade Commissioner Service, or TCS?
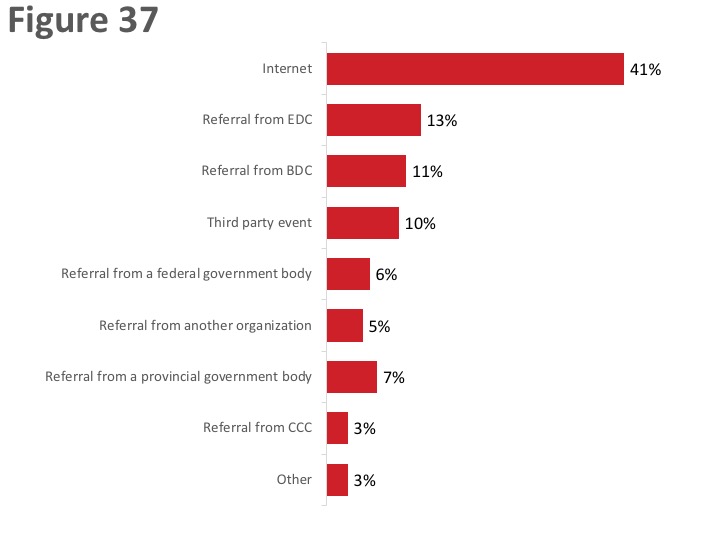
Four in 10 first learned about the TCS via the internet
Those aware of the TCS were most likely to have initially learned about the TCS through the internet (40%). Following this, a small number of respondents mentioned a referral from Export Development Canada (EDC) (13%) or the Business Development Bank of Canada (BDC) (11%) and via a third-party event (10%). All other sources of awareness were mentioned by fewer than one in 10.
Figure 37: Source of Awareness of TCS
Text Description - Figure 37
Base: n=116; those aware of TCS. [Dk/nr: 14%; n=13 removed] / F4. How did you initially learn about the Trade Commissioner Service (or TCS)?
VII. Communication Preferences and Information Needs
This section presents findings on respondents’ communication preferences and information needs.
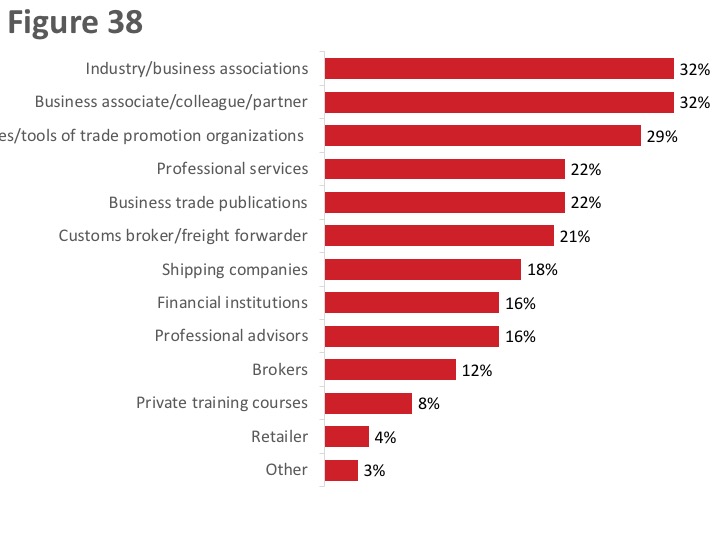
Top information sources for doing business abroad – associations and colleagues
When asked where they get their information and advice on doing business abroad, such as exporting and using free trade agreements, approximately one-third each mentioned industry or business associations (32%) and business associates, colleagues, or partners (32%).
Twenty-nine percent use the websites or free online tools of trade promotion organizations. Respondents who use the information and resources of trade promotion organizations (n=49) were most likely to mention BDC (50%), followed at a distance by EDC (38%), provincial export organizations (26%), and the Trade Commissioner Service (20%).
Approximately two in 10 use professional services (22%), business trade publications (22%), and customs brokers/freight forwarders (21%), while smaller proportions rely on shipping companies (18%), financial institutions (16%), professional advisors (12%), brokers (12%), private training courses (8%), and retailers (4%) for information and advice on doing business abroad.
Figure 38: Information Sources for Doing Business Abroad
Text Description - Figure 38
Base: n=507; all respondents. [Dk/nr: 5%, n=22 removed] / G1. Where do you get your information and advice on doing business abroad (i.e., exporting and/or using free trade agreements)? (multiple responses accepted)
The likelihood of using industry and business associations was higher among companies that currently export to free agreement countries (34% versus 17%) and among those aware of the TCS (50% versus 25% of those not aware). The likelihood of using a business associate or colleague was higher among companies in western Canada (32%) and Ontario (36%) compared to those in Quebec (18%), those aware of the TCS (44% versus 23%), and those companies that export services only (38% compared to 30% of those that export goods and services).
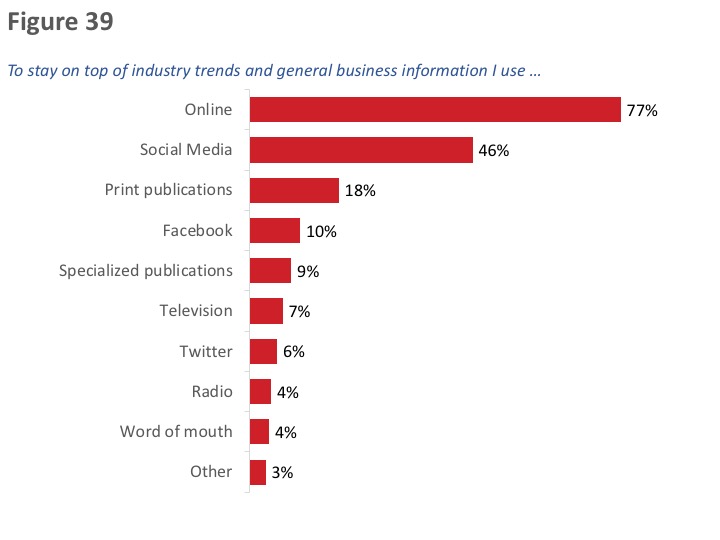
Vast majority uses the internet to stay on top of industry trends and general business information
Just over three-quarters (77%) of respondents said they look to the internet when it comes to staying on top of industry trends and general business information. Following this, 46% use social media. Other sources were used by fewer than two in 10.
Figure 39: Information Sources Used to Stay on Top of Industry Trends
Text Description - Figure 39
Base: n=507; all respondents. [Dk/nr: 4%; n=19 removed]. / G2. When it comes to staying on top of industry trends and general business information, where do you typically look? (multiple responses accepted).
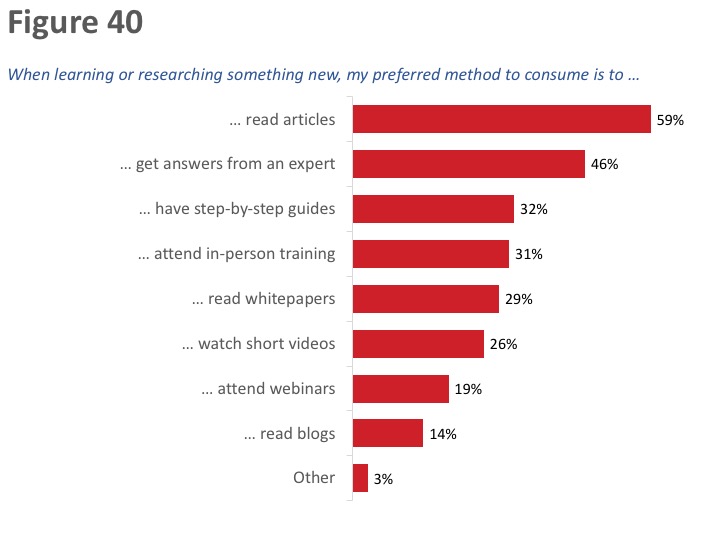
Reading articles, getting answers from experts – top methods to consume information
When learning or researching something new, 59% of respondents prefer to read articles and 46% to get answers from an expert. Approximately one-third each expressed a preference for step-by-step guides (32%) and in-person training (31%), while 29% would like to read whitepapers and 26% would prefer to watch short videos. Following this, 19% prefer to attend webinars and 14% to read blogs.
Figure 40: Preferred Methods to Consume information
Text Description - Figure 40
Base: n=507; all respondents. [Dk/nr: 1%, n=4 removed] / G3. How do you prefer to consume information when learning or researching something new? (multiple responses accepted)
Those who prefer to get their answers from an expert, from in-person training, and from attending webinars were more likely to be aware of the TCS. The likelihood of preferring to get answers from an expert was higher among respondents representing companies planning to start export exporting to countries with which Canada has free trade agreements.
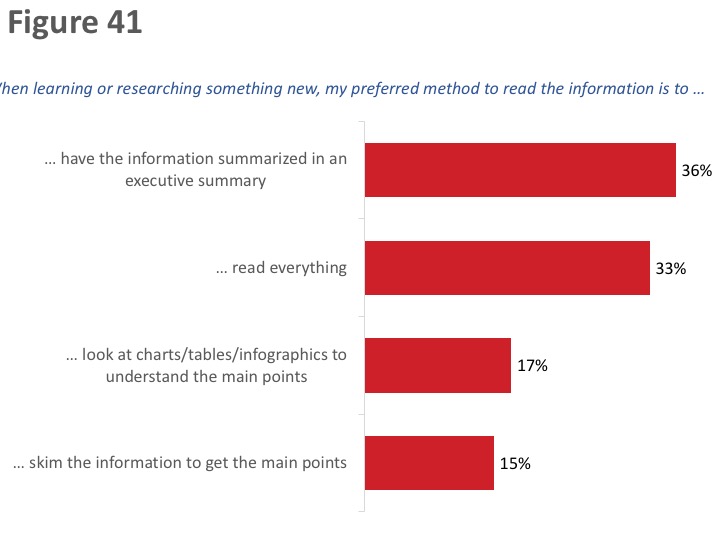
No consensus on preferred methods to read information
Approximately one-third each prefer to have information summarized in an executive summary (36%) or to read everything (33%), while 17% prefer charts, tables, or infographics and 15% skim the information to get the main points.
Figure 41: Preferred Methods to Read information
Text Description - Figure 41
Base: n=507; all respondents. / G4. Which of the following best describes how you prefer to read information?
Those who prefer to read everything were more likely to represent micro-sized firms and companies operating in the information and cultural industries (compared to those active in the manufacturing sector).
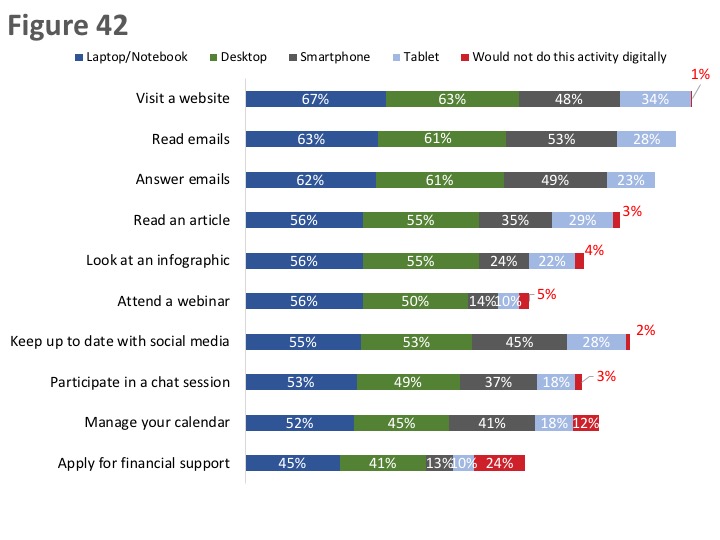
Laptop/desktops preferred to mobile devices for most business tasks
As the graph below depicts, the vast majority of respondents would do all these tasks or activities digitally.
Figure 42: Preferred Device for Various Activities
Text Description - Figure 42
Base: n=507; all respondents. [I don’t do this activity: <0.5%-40%, n=2-144 removed] / G5. On which device would you do each of the following activities? You can choose more than one device for each activity .(multiple responses accepted).
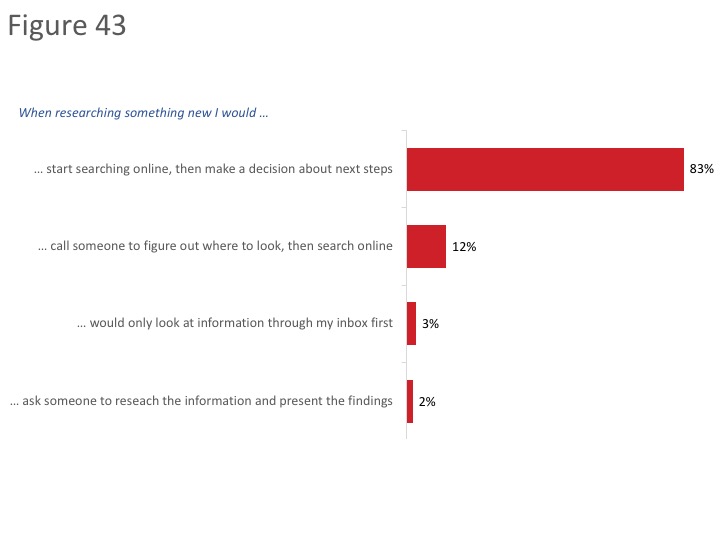
When researching something new, most would start online and then determine next steps
Respondents were asked which of the following descriptions best describes how they would research something new:
- I would call someone first to help me figure out where to look for new information and then I would search for it in a specific place online. I would probably want to have someone to talk to after I found the information just to make sure I have the right information
- I would start searching online for the information I am looking for, sifting through all of the available sources and then making a decision about what my next step is based on everything I learned.
- I would only look at information if it came through my inbox first. I would only go online to search something if the email or subscription caught my attention.
- I would ask someone in my company to research the information for me and present me with their findings
Figure 43: Approach to Researching Something New
Text Description - Figure 43
Base: n= 507; all respondents. / G6. Please choose the option that best describes how you would research something new.
When researching something new, 83% of respondents would start searching online, and then make a decision about what the next step would be based on everything learned. Relatively few would call someone to figure out where to look before searching online (12%), would first only look at information in their inbox (3%), and would ask someone to research the information and present the findings (2%).
Phase 2: In-depth Interviews
I. Context
This section provides background information on participants and their companies’ involvement in international business activities.
Participants’ positions/titles
Participants in this study occupy various positions in their respective companies. Types of job titles held by participants included the following: Owner, President, Chief Executive Officer, Chief Financial Officer, Chief Operating Officer, Chief Accountant, Director of Operations, Chief Designer, General Manager, Manager of Purchasing and Shipping, Sales Manager, Procurement Manager, Sales Executive.
Nature of companies’ international business activities
Types of activities companies engage in as part of their current international business include the following:
- Exporting goods: Examples of goods exported by participants’ companies include steel products, hydraulic cylinders, products related to the hospitality industry, parts for oil wells, automotive parts, cement, valves and pumps, emission combustors, waste water treatment products, machine parts, vehicular electronic products, books/publications, medical products, dry goods, health food products, meat products (specifically pork-based products), software products, custom clothing, cosmetic products, semi-finished products, pet food products, leather goods, jewelry, and horses and equipment for horses.
- Exporting services: Examples of services offered by participants’ companies as part of their international business include web design and development, electronic products design services, legal services, auditing services, consulting services, technical training, online publication services, and marketing-related services.
- Exporting goods and services: Some participants said their companies engage in the export of both goods and services. Examples include exporting products as well as upgrading and servicing them on the ground, offering consulting services as well as manufacturing/exporting goods, exporting products as well as training technicians on the ground, and exporting products as well as installing them on the ground.
- Importing goods, as well as sourcing and importing components as part of a supply/value chain: Some participants said their companies import goods or source/import components or materials as part of a supply or value chain (e.g., importing food products, importing diamonds and other types of gems for the production of jewelry, importing nuts and bolts as components for the production of machinery).
- Presence/involvement in other countries: Some participants specified that they have a presence or involvement in other countries. This includes distribution centers in various locations (e.g., warehouses), employing personnel in other countries (e.g., software developers), and on location/on the ground production (e.g., manufacturing dry goods).
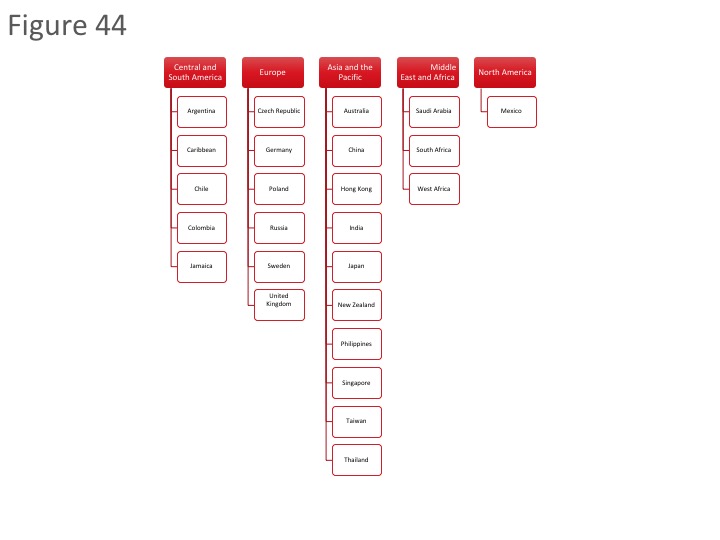
Countries or regions where companies are active
Participants collectively identified numerous countries and/or regions in which their companies are currently active in terms of international business, but the United States (U.S.) followed by Europe/the European Union were most often identified as current markets. Beyond the U.S. and Europe, a variety of specific countries/regions were mentioned by participants.
Figure 44: Companies or regions where companies are active
Text Description - Figure 44
Most participants whose company operates in more than one country or region described their activities as similar or the same (i.e., they undertake the same or similar types of activities in the various regions in which they currently operate). To the extent that there were differences, these differences tended to relate to approaches and strategies as opposed to actual types of activities. For example, some participants said they use different approaches or strategies for marketing their products in different regions, based on various factors (e.g., the nature of their target market, cultural factors, the advice of sales representatives, the availability of distributors and consultants on the ground, their general familiarity with the country or market).
China was occasionally identified specifically as a market in which a different approach is used, given cultural differences between China and the West, as well as the size and diversity of the market (i.e., it can differ from region to region).
Some said their approach or strategy tends to be ‘ad hoc’ or circumstantial (e.g., it depends on who their partners, collaborators/intermediaries, and clients are in various countries). In other words, one adapts one’s approach based on specific circumstances, including the needs, requirements, and preferences of clients and partners. By contrast, authors/novelists who sell and promote their products online (e.g., through Amazon), as well some service providers, said their activities tend to be homogeneous regardless of the market in which they operate.
Length of time companies have been involved in international business
Not surprisingly, there was no consistency or uniformity in terms of how long companies have been involved in international business. Indeed, involvement varied from as recently as the last year to as long as 40 years. That said, most participants said their company has been involved in international business for at least five years.
Some companies began with international focus while most others began with domestic focus
Once again, perhaps not surprisingly, there was no uniformity in terms of how companies got involved in international trade in the first place. That being said, most indicated that their company began with a domestic focus and then later developed an international focus. While there was no uniform path or avenue from the domestic to the international market, certain ‘circumstantial’ factors (and variations on them) were routinely provided to explain the evolution. Such reasons included the following:
- Possibilities arising as a result of connections, networking, and contracting opportunities (e.g., international tenders).
- The growth/expansion of their product or service sector or the area in which the company has expertise (e.g., computer software, electronics).
- A growing international/external demand for the product/service in question.
- Merging with a company that already had an international focus.
- The low value of the Canadian dollar/exchange rates (making it more attractive for international clients to look for a Canadian supplier with expertise in a particular area).
- Limited opportunities in the Canadian market as a result of domestic market conditions (e.g., the oil industry).
- An opportunity/desire to expand as a result of success in the domestic market.
- Opportunities for more widespread marketing afforded by the advent and growth of digital advertising.
Participants who said their company began immediately with an international focus identified the following kinds of reasons to explain why: the fact that the markets for their products are primarily outside Canada (e.g., mass transit systems, horses and horse products), the ability/opportunity to ‘piggy-back’ on large international/multi-national companies (sometimes as a result of free trade agreements), the need for larger market opportunities to offset production costs/overhead, the opportunity to make more money/profit in larger markets (i.e., outside Canada), and personal experience/contacts.
Increasing profits/sales – main reason for being active in international trade
The most frequently given reason by participants for engaging in international business was (or revolved around) increasing or maintaining sales/profits. Participants routinely offered or identified other reasons, but these accompanying reasons usually linked back to increasing or maintaining sales/profits. For example, participants sometimes identified the following: weak Canadian economic conditions (i.e., not/no longer able to maintain profitability in domestic market alone), being approached by a foreign client (i.e., opportunity to increase profits/enter a new market), and to grow/expand in new markets (i.e., payoff or return on investment is better in larger markets with more clients and more distribution networks).
In some instances, participants noted that what they offer is a niche product or service, designed for specific markets (e.g., products/services designed for earthquake or disaster zones, a breed of horse in demand only in the U.S., products for mass transit systems in large cities). But even in these cases, profitability was a factor. In the case of publishers or novelists, it was also noted that the medium in which they work (i.e., online publishing) is by its very nature international.
Given the centrality of profit a factor motivating companies to seek international business opportunities, it is not surprising that participants’ reasons for being active in international business have not changed substantially over time. What has changed relates to what they have learned or confirmed as a result of their experience in international trade—for example, awareness/understanding of international markets has increased over time, global economic conditions have provided their business/company the opportunity to grow in a way the Canadian market does not offer, and companies have adjusted their marketing approach as a result of entry into the international market (i.e., digital as opposed to print media).
Approaches to international business tend to be part of corporate strategy
Although international business opportunities may have initially arisen in an ad hoc manner, and as a result of circumstances, participants most often described their company’s approach towards its international business activities as part of a plan or business strategy. Representatives of smaller companies and/or companies just recently launched into international trade sometimes described their approach (or part of their approach) as ad hoc (i.e., when and if the opportunity arises) because their situation is still precarious (e.g., they are just starting out, they still go from contact to contract, they have a new distributor and are still ironing out details, they do not want to expand too quickly for fear of exceeding their capacity to meet demand).
Service providers were more likely to describe their approach to international business as ad hoc or circumstantial (i.e., taking on contacts/opportunities if and when they present themselves). A few participants described their company’s approach as involving both a corporate strategy and an ad hoc approach (i.e., they actively engage in the pursuit of/nurturing of opportunities, but on occasion someone will approach them and, if they are able to, they will accept the opportunity).
II. Challenges related to international business activities
This section reports feedback related to challenges experienced by Canadian companies engaged in international business activities.
Variety of challenges associated with international business
Participants collectively identified a number of challenges or obstacles their companies face in relation to their current activities in international markets. They include the following, with those prefaced by an asterisk identified most frequently.
- *Making connections/networking/discovering opportunities and customers: This was identified primarily by representatives of smaller firms and firms that have recently entered into international trade. This was described as an important challenge because it is important to have knowledgeable ‘people on the ground’ to facilitate entry into a foreign market or at least survey the lay of the land (e.g., confirm or provide information about the market/product market).
- *Exchange rates/fluctuations/value of the Canadian dollar: This is an important challenge because it affects costs if one sources materials or products in a country with a stronger currency. As well, fluctuations affect the ability to forecast costs and profits because calculations may have to be revised based on fluctuating exchange rates. Ultimately this can affect the competitiveness of one’s pricing.
-
*Assistance with rules, regulations, policies and standards: This was described as a challenge because it requires a lot of time and effort to understand, not to say be aware of, all the rules and regulations that apply in various jurisdictions and with which one must comply (e.g., health and safety standards, labelling and packaging requirements, certifications/approvals to send products across various borders/checkpoints). Moreover, it was noted that the challenge is complicated by the fact that standards are not homogeneous. Two more specific subsets of this kind of challenge were identified:
- One related to what were described as red tape/bureaucracy in terms of moving goods across the Canada/U.S. border (i.e., customs regulation, issues related to Canadian customs collecting the GST). One participant observed that his/her U.S. client is considering ending their relationship because trans-border trade is just too cumbersome).
- The other related to legal issues/complexities (e.g., how to register one’s business internationally/does it need to be registered, tax implications of doing business in China, suing for payment in foreign jurisdictions, declaring international income in Canada).
- *Strategic information: This was seen to include such things as market analyses, potential growth areas, potential demand for products and services, competition, and the political situation/climate in general. This was described as a challenge because of the time and effort required to get it, but also because of possible conflicting information.
- *Reliable partners (i.e., suppliers/distributors/brokers): A number of participants said that one of the challenges they face is finding reliable suppliers, brokers, and distributors to move their goods. This was described as a challenge because it can be difficult to know in advance who is and who is not reliable, and yet knowing this is crucial to ensuring that one’s products are delivered according to schedule and in quality condition.
- *Financial assistance/capital: This was identified primarily by representatives of smaller firms and included getting working/seed capital as well as capital/funding to help finance expansion into international markets. It was identified as a challenge because it can take a while to get contracts and get paid, but companies have a lot of up-front costs that have to be paid for. A few participants noted in this regard that because their companies are small, financial institutions are reluctant to help them in this regard.
A host of other challenges or obstacles were identified less frequently, or by no more than a few participants. These included the following:
- Distance dealings/time zone issues: This was described as a challenge because of the difficulty setting up meetings when the business day might be beginning in one region but ending in another.
- Linguistic barriers: This was identified primarily in relation to trade with China and/or south-east Asia, but regardless of the area the key issue was difficultly communicating with partners/potential partners and clients because of linguistic differences and the need to rely on translators and interpreters.
- International payment issues, specifically credit unions refusing to engage in direct bank to bank transfers internationally.
- Payment problems: This includes dealing with clients who do not pay regularly or on time or even default on payments. This occasionally results in legal issues which are inevitably complicated.
- Corruption/unethical practices: This includes such practices as bribery, piracy, and copyright/ trademark violations (e.g., ‘knock-offs’).
- Quality assurance: It was observed that lack of quality control standards in certain jurisdictions can be an obstacle when one is supplied through such jurisdictions (e.g., being shipped shoddy or incomplete equipment adversely affects the ultimate quality of one’s product as well as the ability to meet deadlines).
- Shipping, delivery, storage issues/problems: This includes making sure that everything is synchronized in terms of the production, shipping, storage, and distribution of goods. A mistake or delay in one area will have a ripple effect throughout the entire process. This was linked to the need to have reliable partners.
- Getting letters of credit/posting collateral: This was identified as a challenge by a few representatives of small firms.
- Difficulty finding personnel/meeting demand: This was described as a challenge because it affects one’s ability to accept or bid on new contracts (i.e., if one does not have the human resources needed to fulfill a contract or order, one cannot take on the work or meet the demand). Examples included finding software developers, business analysts, machinists, and welders.
- Linking up with larger companies: A few representatives of small firms said that a challenge they face has to do with the fact that they need to link up with bigger companies as sub-contractors in order to get international work. Specifically, they face the challenge of having to market themselves and their skills to large international companies. In one instance this was linked to the challenge of finding capital/getting financial assistance in the sense that trying to liaise with large companies to market oneself can be costly.
- Unforeseen circumstances: A few participants said that unforeseen circumstances have affected them or can affect them in terms of creating challenges or obstacles. Actual unforeseen circumstances that have created such challenges include the U.S. tariffs on steel and aluminum and Brexit. It was noted more generally that unforeseen circumstances can cause obstacles by creating interruptions along supply chains (e.g., labour problems, political unrest, natural disasters/extreme weather).
- Setting up shipping/transportation routes: This was identified as a challenge because of the need to find the best/most effective routes for shipping one’s products (including considerations of timelines), while at the same time being mindful of the costs associated with the routes in question.
- Gaining exposure/promoting one’s products internationally: A couple of participants identified this as particularly challenging because they source products from South America and Mexico, and many retailers prefer to purchase similar products from the United States on the assumption that they are of better quality. In other words, there is an assumption that certain products sourced in Mexico and/or South America are not as good as U.S. equivalents.
Challenges related to diversification echo challenges related to international markets
The most important issues or challenges that affect participants’ companies’ ability to diversify and enter new markets tended to be similar to the challenges affecting their current activities in international markets. The main difference was that these challenges tended to be exacerbated or more acute when entering, or thinking of entering, a new market. Specifically, the following previously mentioned challenges were most often described as more significant when entering a new market:
- Making connections/networking/discovering opportunities/customers.
- Assistance with rules/regulations/policies/standards (e.g., steps involved in entering the market – documentation, fulfilling the regulatory requirements).
- Strategic information (e.g., market analyses, potential demand for products or services, existing competition, labour laws/hiring requirements, political, social, and economic situation/climate).
- Finding reliable partners (i.e., suppliers/distributors/brokers).
- Financial assistance/capital (e.g., may need to hire consultants, new/additional sales personnel/managers, additional employees)
- Potential cultural/linguistic barriers/challenges: This was seen to involve not only to difficulties communicating but also challenges related to marketing a product effectively by taking into account cultural differences.
- Shipping, delivery, storage issues (e.g., setting up warehouses and distribution networks based on what makes sense in terms of routes, costs, tariffs).
- Gaining exposure/promoting one’s products, including convincing a potential customer to accept a new supplier.
- Ability to meet demand/expand (e.g., can’t move into new market without more employees but can’t hire more employees without a contract).
Another challenge identified by some, and associated with the ones previously mentioned, was limited time and resources available to devote to addressing these challenges. Some participants specified that they are not interested (or not interested at this time) in entering new markets or diversifying.
Types of support/assistance considered most valuable to help address challenges
When interview respondents were asked what type of support or assistance would be most valuable or useful to their company to help address challenges related to their current international business activities the following were mentioned[7].
-
Advice to help understand and navigate international rules, regulations and policies: Interview participants mentioned that they need a clear understanding and up-to-date information on existing regulations and agreements, including any changes or amendments to them. More specifically, they need advice on the following:
-
Legal information:
- How to negotiate and write up international contracts.
- How to protect themselves when and if legal issues arise.
-
Tax information:
- How to declare international income.
-
Free Trade Agreements:
- Understanding how to: 1) take advantage of FTAs; 2) determine if they apply to specific product or services; and 3) navigate non-tariff trade barriers. In short, participants described a need for a clear and easy to follow reference about the various foreign trade agreements.
- International standards: How to meet international standards vis-à-vis products and services (e.g., standards around food or meat and packaging).
- General advice about how to operate in different regions – such as potential sources for reputable contacts and liaisons, and rules and regulations regarding working in foreign countries (e.g., work permits).
-
Financial assistance/capital to help expand to international markets: Some exporters would be interested in insurance and credit to help them cover for loss/damage and non-payment issues, as well as loans to start a new venture internationally. A few mentioned that current loan and funding sources are too expensive – interest rates are too high - or that because they are too small financial institutions will not help them (i.e., they are seen as too much of a risk).
-
Foreign contacts to implement market plans (“boots on ground”): Foreign contacts are particularly important for markets that businesses are not familiar with. Finding reliable and reputable contacts was described as difficult for some – i.e.: contacts who provide accurate information. Foreign contacts would also help address any issues faced by language and cultural barriers.
-
Competitive intelligence: Information on demographics, industries, potential clients and competitors to help Canadian businesses determine whether to bid on an international project (or even become involved in the procurement process). Examples include:
- Trade forecast information for different global markets – a forecasting of where a region plans to focus growth (i.e.: in what sector, through what means – government spending?)
-
Business leads and foreign contacts, specifically potential sub-contractors in different markets. Interview participants mentioned that it is very important to establish a long-term relationship with reputable brokers and sub-contractors in order to be able to bid on contracts in international markets.
-
More government assistance or support [general]: This included:
- More inclusive rules or policies about the types of products or services for which a Canadian company can apply for government support or assistance.
- Assistance to promote Canadian expertise internationally.
- More assistance, generally, to help export-ready companies take their business international.
- Efforts/support from the Government of Canada to make trade fairer, to regulate or standardize international trading behaviour among Canadian businesses.
Several interview participants said their business does not need support or assistance from the Government of Canada because the challenges they face are specific to their business (e.g., a company that creates custom clothing identified finding the right materials as a challenge, but this is not a challenge that can be addressed by government at any level).
III. International free trade agreements
This section reports feedback related to Canada’s free trade agreements.
Widespread awareness of Canada’s free trade agreements; limited knowledge of details
Participants were aware that Canada is involved in various international free trade agreements, and most could identify one or more either by name (or some variation on the name), acronym, or region/regional focus. That said, participants were most likely to be aware of the renegotiated North American Free Trade Agreement (the Canada-United States-Mexico [CUSMA] Free Trade Agreement), followed by CPTPP and CETA. While awareness that Canada was involved in free trade agreements was widespread, knowledge of provisions or details of specific agreements was limited. Providers of goods were much more likely to identify (or try to identify) details regarding various free trade agreements, while service providers were more likely to comment on free trade agreements in general. Feedback regarding specific free trade agreements is provided below.
- CUSMA: Participants were most likely to provide comments or details regarding CUSMA, but they tended to focus more on issues or problems inhibiting ratification of the agreement, sometimes with a focus on how their own activities have been adversely affected. Perhaps not surprisingly, they referred most often to the imposition of tariffs on Canadian steel and aluminum (but mostly the former). Other issues or barriers identified included Canada’s response to the latter by imposing countervailing measures, U.S. opposition to supply management, and problems related to the export of softwood lumber. References to specific provisions included changes regarding the auto industry (i.e., more car parts must be produced in North America to qualify for tariff exemption), the duty-free shopping limit for online products has been increased, increased patent protection for certain products, and the inclusion of health food products.
- CPTPP: The only frequently identified details regarding this free trade agreement were references to its membership and/or region (e.g., it involves 12 countries, the focus is the Asia-Pacific region). It was also observed that it has recently been ratified (i.e., it is now in force), that it is a very large free trade agreement in terms of the area included, that it provides new outlets for Canadian products, that it reduces tariffs on agricultural products, and that it includes environmental protection provisions.
- CETA: Here as well, the most frequently identified feature of the agreement was its membership (e.g., the European Union/Europe/European countries). Specific features identified, or referred to, included the reduction/elimination of tariffs on many Canadian products, the inclusion of dairy products, environmental and labour protection laws, and strict rules/requirements regarding such things as labelling and packaging of products.
Other specific free trade agreements of which participants were aware, but about which no details were provided included the following:
- Canada-Chile FTA
- Canada-China FTA
- Canada-Israel FTA
- Canada-Chile FTA
- Canada-Ukraine FTA
- Canada-Korea FTA
General assumptions about FTAs
Features that participants associate with free trade agreements, or general assumptions participants have about them, included the following, all of which were routinely identified:
- Their purpose is to reduce or eliminate tariff barriers to allow for the free movement of goods and services.
- Tariffs and duties are reduced/removed for specific regions or specific products or services being exported or imported.
- They enhance opportunities to sell products/services internationally.
- These are negotiated agreements for specific products.
- They do not apply to services industry (identified specifically by service providers).
- They can take various forms in terms of membership (i.e., multilateral, tri-lateral, bi-lateral).
- They can be very complex when it comes to the details of the agreements (e.g., rules/requirements/regulations, exceptions).
Perceived benefits of free trade agreements
Participants whose companies are involved in the trade of goods were much more likely than those providing services to identify benefits of free trade agreements. Indeed, when it came to the benefits of free trade agreements, most service providers said that free trade agreements apply primarily or exclusively to products not services. Among those involved in trading goods, the following benefits were identified:
- Access to international/wider markets, duty free.
- Opportunities to expand one’s business/increase profits/diversify one’s clients.
- Harmonization of regulations and standards which facilitates trade.
- Creation of a level playing field for all actors in international trade.
- Potentially greater exposure for products.
- Fewer rules/regulations/red tape when it comes to entering new markets (as long as one’s products are included in the free trade agreement in question).
Additional benefits identified less frequently included the following:
- Ability to take advantage of niche markets.
- Ability to exploit competitive advantages.
- Ability to partner with other companies.
- Potential for new sources for products/new supply chains.
- Lower prices for consumers (resulting in potentially greater demand for products).
- Greater range of opportunities, so that one does not need to put all one’s eggs in one basket (i.e., rely on one market).
- Beneficial to poorer/developing countries by providing more opportunities to better their economies (e.g., investment, employment).
- Dispute resolution mechanisms.
- FTAs provide security/protection when doing business internationally (e.g., ratification requires respecting provisions which in turn provides predictability to companies).
Perceived challenges associated with free trade agreements
As was the case regarding benefits, participants involved with goods/products were much more likely to identify challenges associated with free trade agreements. Challenges tended to fall into the following categories:
-
Competition/increased competition: Participants frequently observed that one of the challenges associated with free trade agreements was increased competition. This challenge was formulated in various ways, including the following:
- Increased competition, both in the domestic and international market, as a result of more companies offering similar/the same products, possibly at cheaper prices.
- Increased competition as a result of entering a market with well established competitors.
- Competition from larger companies, which can enter a market easily as a result of greater resources (e.g., marketing studies, connections/networks).
- Challenges for small companies: A number of representatives of small companies suggested that free trade agreements tend to be more beneficial to large companies (e.g., their resources, financial and other, allow them to take advantage of the provisions of agreements (not to say influence the agreements themselves) much more than small companies.
-
Terms of agreements: The terms of an agreement, particularly what is and is not covered by or included in a specific free trade agreement, was identified a potential challenge for companies because terms have to be complied with. Examples included the following:
- What products and services are included in the agreement (e.g., are one’s products or services covered by an agreement).
- What non-tariff requirements/regulations/standards are included in the agreement (e.g. health and safety standards, labour standards/requirements, environmental standards, packaging and labelling requirements). Related to this, it was observed that the challenge can be greater the more the standards in question differ from standards in Canada.
- Dispute settlement mechanisms (e.g., what if anything is in place to resolve potential disputes or legal issues).
- Protection of copyright, trademarks (e.g., does the agreement provide for protection against violation of trademarks, copyright, intellectual property).
-
Understanding details/terms of agreements: In addition to the actual terms of agreements, it was routinely observed that FTAs are complicated arrangements, so that one challenge they pose is that they can be difficult to understand in all their details. Examples included the following:
- Understanding of non-tariff requirements/regulations/standards.
- Exceptions to regulations/loopholes (if any), quotas, rules regarding domestic content/sourcing of products or parts of products,
- Limitation on products that can be transported between borders, legal implications (e.g., tax implications, laws regarding sub-contractors and foreign workers).
In the words of one participant, understanding the requirements is crucial in order to be able to ‘dot all the ‘I’s and cross all the ‘T’s. Otherwise, if regulations aren’t met, the result is that one’s transactions get held up.
- Unfair trade practices: It was observed that despite general agreement among countries that free trade is a good thing, there are always attempts to circumvent provisions of such agreements in order to seek an unfair advantage. Examples included protectionism/unfair restrictions, corruption/bribery, dumping practices, subsidization of domestic industries, and simply not respecting the provisions of an agreement). In this sense free trade agreements do not necessarily create a level playing field. In this regard, it was observed that a challenge related to free trade agreements has to do with the strength of their compliance/enforcement mechanisms (i.e., do they have teeth in them).
The following types of challenges associated with free trade agreements were identified less frequently:
- Exchange rates/fluctuations/value of the Canadian dollar: This had been identified as a challenge related to international trade in general, but it was also identified more specifically as a challenge related to free trade. Fluctuations in exchange rates can affect the ability to forecast costs and profits because calculations may have to be revised based on fluctuating exchange rates. This can affect the competitiveness of one’s pricing in a free trade environment.
- Non-tariff barriers: it was suggested that one challenge associated with FTAs is that while they may reduce tariff barriers there may still include or be subject to non-tariff barriers that create challenges. Examples included complying with rules and regulations related to packaging and labelling, rules regarding trans-border work/employment, security issues and regulations affecting transborder trade post 9/11, and dealing with customs officials (e.g., paperwork/documentation/certifications associated with cross-border trade).
- Setting up distribution networks/supply chains: While free trade agreements expand trade opportunities, these opportunities also involve challenges such as setting up distribution networks/supply chains, especially if and when entering a new market. More specifically, the challenge was described as the ability to get a product to one’s customers on time and in good condition. This requires that one have a reliable network (e.g., shippers, distributors, customs brokers).
NAFTA identified as FTA most likely to be used
Most participants said their company is currently using or thinking about using one of Canada’s free trade agreements. That said, they were almost all representatives of companies whose international activities involve goods/products as opposed to the selling of services. In addition, NAFTA was, by far, the most frequently identified agreement to be identified in this regard, followed at a distance by CPTPP and Canada–European Free Trade Association Free Trade Agreement. A few participants said they are thinking of using the Canada-China FTA, while individual participants respectively identified the Canada-Colombia FTA and the Canada-Peru FTA.
Asked how they use or anticipate using the agreements in question, participants typically said they use the agreements to ship their products across borders, taking advantage of the particular agreement’s non-tariff or low-tariff provisions. Some said that under the agreement they also import products or source components. A few participants added that under NAFTA they have entered into partnerships with U.S. firms, invested in the U.S., and established supply chains and distribution networks for their products (e.g., warehouses).
Types of challenges faced in relation to FTAs
A number of participants said their company has not (or not yet) faced any challenges related to the FTAs in which they are involved. Participants who did identify challenges related to the FTAs in which they are involved tended to characterize them as small or moderate challenges. In some instances, challenges were of a general nature (i.e., they did not necessarily apply to a specific trade agreement). For example, some participants said that it is a challenge familiarizing themselves with the provisions of trade agreements in which they are involved (e.g., rules of origin). In the case of the new/revised NAFTA agreement, some participants said it is a challenge to understand what is new/different between the new and the old NAFTA agreement. A few participants whose companies are involved in more than one agreement said that a challenge they face is understanding similarities and differences between the various agreements in which they are involved.
Challenges associated with specific trade agreements included the following:
-
CETA
- Compliance with requirements of the CETA free trade agreement. This included requirements related to packaging, labelling, and environmental regulations which were identified as different from regulations in Canada (i.e., in the domestic market).
- Increased paperwork burden/requirements.
- How will Brexit affect CETA/how will trade with the UK be affected after Brexit.
- Linguistic barriers.
- Increased competition in Canada from European suppliers.
- Finding local/regional agents.
- Finding niche markets and/or the most attractive markets.
- Potential political instability in Eastern Europe.
- Corruption in Eastern European countries.
-
Renegotiated NAFTA
- Uncertainty (will/when will the agreement be ratified).
- Effect of U.S. duties on steel and aluminium (e.g., increased costs).
- Weak Canadian dollar/exchange rate.
- Dealing with American protectionism/convincing potential clients to take on a Canadian supplier.
- How/where to set up supply lines in U.S. and/or Mexico.
- Communications barriers in Mexico.
- Finding local/regional agents.
-
CPTPP
- Understanding the side agreements that involve Canada.
- Understanding the numerous rules/regulations (e.g., customs duties, rules of origin, government procurement).
- Rules regarding shipping (e.g., shipping directly versus transit through another country.
- Distance dealings/time zone issues.
- Cultural/linguistic barriers in certain countries.
- Making connections/networking/discovering opportunities/customers.
- Determining which markets are most promising.
-
Canada-Colombia FTA
- Need to order large amounts of products/materials in order to compensate for the cost of transportation.
- Consumers have negative perceptions regarding the quality of products shipped from South America.
Participants who anticipate challenges related to FTAs their company plans to use (or is thinking of using) tended to focus on the challenge of familiarizing themselves with the provisions of the trade agreements themselves. More specific anticipated challenges included the following:
- Dealing the uncertainty generated by Brexit (e.g., How will BREXIT impact the CETA agreement? Will my company need to operate differently in the UK?).
- Challenges posed by CETA (e.g., rules of origin, documentation requirements).
- Will free trade with China be fair (e.g., will foreign products have fair access to the Chinese market).
- Dealing with bureaucracy/regulations related to free trade with China.
- Challenges posed by shoddy products/components shipped from China (e.g., what to do if and when products/components imported from China are not up to standard).
Most participants said their company has not sought or looked for assistance to deal with these challenges. The main reason given to explain why was that internal sources have been sufficient to date. That being said, a number of participants said their company has sought assistance. The most frequently identified sources for such assistance were existing networks and business-related connections. Some identified industry/trade associations, and some identified Canadian government sources including Export Development Canada, the Business Development Bank of Canada, Global Affairs Canada, and Canadian embassies, consulates, and High Commissions in various countries.
Potential assistance with FTA challenges
Asked specifically what more the Government of Canada/Global Affairs Canada or the Trade Commissioner Service could do to assist them in addressing challenges related to foreign trade agreements the following were mentioned:
-
Improve existing FTAs and create more FTAs with other regions/countries: Some mentioned they want the agreements to be more inclusive of a wider range of products and services, including online products. For example:
- One participant mentioned including more pork-based products in existing FTAs so the company can secure more trading opportunities.
- Another interviewee mentioned that those who sell their products online should be able to utilize FTAs as well.
- More assistance from government when dealing with an international customer who will not pay for the products/services rendered: It was suggested that the Government of Canada could do more to help protect Canadian exporters from non-payment or situations in which the products purchased from international customers are faulty or do not meet the quoted specifications.
- Resources to help Canadian exporters acquire general knowledge about doing business with international clients operating in an unfamiliar market (i.e., a market in which the Canadian company does not have experience or knowledge). It was suggested by several participants that a basic “dos and don’ts from a cultural perspective (i.e.: how to address bribery situations, how to interact with clients in a social setting versus business setting) would be helpful.
- Better promotion by the Government of Canada of the services and resources it offers Canadian businesses involved in or looking to expand internationally: Some interview participants even mentioned that the Government of Canada should make a greater effort to: 1) promote existing FTAs to small businesses; and 2) understand the types of challenges and issues unique to small and medium-sizes businesses when growing internationally.
-
A few participants suggested that the Government of Canada should create a resource (one that is easily accessible) which lists all Canadian FTAs. Features of such as resource could include:
- The similarities and differences between the FTAs.
- A list of products and services included in each agreement.
- Specific tariff information.
- A “wizard” or step by step guide to help prospective users learn how to properly use FTAs to their advantage.
- More financial assistance from the Government of Canada in order to increase the number of international opportunities companies have the capacity and resources to take on.
Reasons for not using or not thinking about using free trade agreements
Participants who said their company is not using or not thinking of using any of the free trade agreements Canada is involved provided various reasons to explain why. These included the following:
- Service sector: One reason given by participants whose companies work in the service sector was that because they work in the service sector, free trade agreements do not apply to them (the assumption being that such agreements apply exclusively or mainly to providers of goods or products).
- Line of business unaffected by FTAs: Some said they do not use FTAs because such agreements do not affect or do not significantly affect their line of business (e.g., photography, publishing, consulting).
- Lack of need: Some said their company has not yet felt a need to use FTAs.
- Company size: Some suggested that FTAs are designed primarily for large companies (not small companies like theirs).
- Lack of information: A few said they have not used or thought of using FTAs because they do not know where to begin looking for information about them.
IV. Information Needs
This section reports on participants’ information needs and preferences in terms of pursuing their international business activities.
Companies’ main information needs in terms of pursuing international business activities
Perhaps not surprisingly, when participants were asked what their company’s main information needs were in terms of pursuing international business activities, they often revisited issues identified earlier when asked about the challenges or obstacles their companies face in relation to their current activities in international markets. Specific types of information identified are listed below and classified by theme to facilitate review[8].
-
Strategic information/advice: Participants routinely identified a need for information that could be characterized as ‘strategic’, including the following:
- Market analyses (e.g., potential growth areas, purchasing patterns, potential demand for products and services, existing competition, how to tailor products to provide value/meet a need/demand, market trends/developments, demographic data, trends/tendencies in exchange rate stability/fluctuation over time).
- Strategic advice on entering foreign markets (e.g., marketing/advertising advice, how to price products in a competitive market, cultural factors to take into account).
- ‘Dos and don’ts’ in conducting business in a specific country/region (e.g., who to deal with/who to avoid, what to be attentive to/amber lights).
- Information on corruption/unethical practices and how to deal with them.
- Information on the political situation/climate in a country/region (e.g., political volatility, potential instability).
- Advice on conducting business/communicating across time zones.
- Advice/information on risk management (e.g., supply line disruptions, non-payment, political instability).
- Basic checklist of things to remember (e.g., ‘have you done …X, Y, Z).
-
Business leads: This included information and advice related to potential business opportunities including the following:
- How to look for/find potential partners (e.g., suppliers, distributors) and customers in a new market.
- Market opportunities/emerging markets for products in countries that are part of FTAs of which Canada is part.
- Information about trade missions and trade-related events in or about various countries (e.g., trade fairs and conferences).
- Lists/information about reputable suppliers, distributors, brokers in various countries.
- Contacts/foreign contacts to help implement market plans (e.g., distributors/suppliers that are reputable/reliable, sales representatives, customs brokers, trade representatives from Canada in other countries, translation and interpretation services).
-
Information about international rules, regulations, policies: Participants routinely identified a need for such information, including the following specific types of information in various countries/regions:
- Health and safety standards.
- Environmental laws/regulations.
- Labour laws/regulations in foreign jurisdictions (e.g., minimum wage, requirements to use unionized labour).
- Labelling and packaging requirements.
- Types of certifications/approvals required at borders.
- Tax implications of doing business in China.
- Suing for payment in foreign jurisdictions.
- Declaring international income.
- One-stop shopping re FTAs/Short overview of all free-trade agreements (similarities and differences).
- Rules/requirements regarding transportation of livestock across the Canada-U.S. border.
- Rules/regulations and recourse regarding copyright and intellectual property rights protection.
- Applying for work visas.
In addition to these, some participants representing small companies said they need information on available financial assistance (e.g., seed capital). Other types of information needed included general information on doing business in China, and how the new NAFTA differs from the old.
Constraints/problems in obtaining the information to support international business
A number of participants, service providers in particular, said they face few or no constraints or problems in obtaining the information they need to support their international business activities. On the other hand, a number of participants, primarily representatives of small companies and sole proprietors, identified such constraints. These included the following:
- Lack of time: The most frequently identified constraint was lack of time to devote to finding information. A variation on this, identified by some, was not having enough time to go through the information they do find. In other words, the problem is that they have limited time to devote to ‘wading through’ the information they do have access to.
-
Lack of expertise/qualified staff: This constraint takes a variety of forms, including the following:
- Not knowing where to look/begin.
- Ease finding general information but more difficulty finding specific information/details.
- Difficulty understanding the details, given their complexity and/or the use of technical/bureaucratic language.
- Difficulty assessing the validity of various sources of information (e.g., is it reliable or accurate).
- Lack of contacts ‘on the ground’ (i.e., in the country/region in question).
- Costs: Some participants identified costs or potential costs associated with finding such information. This included information sources/resources that have a fee/cost, having to hire/pay people to find or access information (e.g., lawyers to interpret rules/regulations, translators to interpret untranslated materials, people ‘on the ground’, with first-hand/relevant/reliable knowledge.
- Getting information in a timely manner: Some identified one constraint as needing to get information ‘quickly’ or in a timely manner. In the words of one participant, the challenge is getting information that’s ‘ahead of the game’ and allows him/her to be proactive as opposed to reactive in terms of exploring and assessing opportunities.
Sources of information tend to vary depending on specific needs
Generally-speaking, participants indicated that they tend to use different sources of information for their international business activities. This most often involved using different sources for different types of information (e.g., tax specialists/accountants for tax issues, banks/financial institutions regarding lines of credit, government sources for rules/regulations). In addition to using different sources for different types of information, some said they use different sources for the same type of information in order to verify or doublecheck the information from ne source by comparing it with another. Some representatives of larger companies said they use different sources because they have access to a broad range of sources through their networks and connections (e.g., customs brokers, shippers and distributors.
Participants who said they use or tend to use the same or similar sources gave different reasons to explain why. For example, a few representatives of small firms said they rely on the Internet, a single source that gives them access to a wide range of information and resources. Some representatives said they rely on ‘internal sources’ because these are sufficient to meet all their information needs (i.e., they are self-reliant for most of their business needs). Finally, a few said they use the same or similar sources because their information needs are rather limited and/or adequately serviced by one source of information (e.g., they have a tried and trusted source of information).
Perceived level of expertise in finding information/resources varies
Perhaps not surprisingly, participants’ descriptions of their own level of expertise when it comes to finding information and resources to assist their company with its international business activities varied. Assessments ranged from high or very good to basic /satisfactory, to limited or mediocre.
Characteristics or features of a good information resource
When it came to characteristics of what constitutes a good or valuable information resource, participants tended to identify similar characteristics in terms of both form (i.e., design/layout, format) and content. These characteristics are listed below under each of these two headings (i.e., form and content).
-
Form
When it comes to the presentation of information, the following characteristics were routinely identified as valuable by participants:
- Use of headings: This was described as valuable because it breaks up the text (e.g., makes it less dense) and makes it easier to scan the information to determine what might be more relevant/useful. Some added that this is important given the limited time they have to devote to looking for information.
- Versatility: Participants routinely said they like information resources to be versatile in the sense that they provide both high level overviews (i.e., a summary or quick snapshot), along with the ability to dig down for more detailed/fulsome information.
- Bulleted points/text: As was the case with the use of headings, bulleted text was described as useful because it breaks up the text (e.g., makes it less dense) and makes it easier to read and to scan.
- Embedded links: When it came to online resources, a number of participants said they like information resources to include embedded links to additional resources because it allows them to search for additional, complementary, or supportive (i.e., validating) information.
- Use of graphics/charts/tables: Many participants said they like to see charts, graphics, and tables in information resources because they complement text and helps summarize or helps them visualize key points. Some also said that graphics help break up text, and a few described themselves as visual thinkers (i.e., graphics help them better understand information).
- Variety in terms of formats: A number of participants said they like online sources to be available in a variety of formats because it enhances their user-friendliness. For example, many said they like printable pdf versions because while they like to search for information online, they also like to have access to hard copy versions. Others said they like mobile-friendly versions of information because it allows them to conduct research ‘on the go’ or access it at their convenience.
A few participants said that the design/layout or format of information resources is not particularly important to them. What matters is the content.
-
Content
In terms of the content of information, the following characteristics were routinely identified as valuable by participants:
- Provides insight/helps solve a problem.
- Provides proactive information/information that is timely.
- Information that is credible/reliable (e.g., information that is factual/includes data and statistics, and cites reputable/reliable or relevant sources).
- Information that is expressed in clear, simple language (i.e., not legalese or bureaucratese).
- Information that is up-to-date.
- Information that is precise, not general or vague.
- Information that is complete/comprehensive (i.e., covers all relevant issues).
- Information that provides a good overview (does not lose the forest for the trees).
Preferences when learning or researching something new
Participants did not tend to express strong or exclusive preferences when it came to ways in which they prefer to consume information when learning or researching something new. Rather, they tend to like to have different options at their disposal, as various methods tend to have advantages and disadvantages associated with them. In other words, perceptions regarding various methods tended to be mixed. Below are both the perceived advantages and disadvantages of various ways of learning
- Whitepapers: Two positive features of whitepapers as a way of learning something new were that they are credible, and they provide a lot of detailed information. Additional positive reactions to whitepapers as a way of learning something new tended to be accompanied by caveats, with participants saying they can be good if the subject is relevant, if they are not too long, if they are not written in bureaucratese, and if they are not outdated. Perceived weaknesses of whitepapers tended to the opposite of these features (i.e., they can be too long/dense, not particularly relevant, written in jargon, and out of date by the time they are available).
- Webinars: Participants routinely said they like webinars as a way of learning something new. Reasons included the impression that they tend to focus on essential information, they allow for interaction/Q and As, they are cheap, and they save time. Perceived weaknesses or disadvantages included technical problems accessing them as well as the potential to lose focus/attention if they are too long or seem to lack relevance.
- In-person training: In principle, in-person training tended to be described positively because it is a good way to learn about something new. For example, it allows for interaction and exchange, clarification through discussion and Q&As, and detailed exploration of issues. On the other hand, it can have the disadvantage of being costly and timely, especially if travel is involved.
- Experts: As was the case with in-person training, meeting with or hearing from experts tended to be described positively (as long of curse as the people in question really are experts). That said, it was frequently observed that dealing with experts can be expensive.
- Step-by-step guides: This method was described as useful when learning about new things that involve processes of specific steps (e.g., how to …).
- Short videos: Short videos were considered useful, but some participants said it depends on the topic itself (e.g., they are good for providing updates but not good for complex issues). Some said they do not find them as useful as webinars because there is no possibility of interacting, while others said they are good because they are convenient (e.g., they can be viewed at one’s convenience, they can be watched with others and discussed). As was the case with webinars, a perceived weakness of short videos is the possibility of losing attention
- Blogs: Positive reactions to whitepapers as a way of learning something new tended to be accompanied by the caveat that it depends on the blog in question (is it a credible/knowledgeable/experienced source). Others said they do not like blogs as a way of learning something new because it is too informal/too much like social media. A few added that they might consult blogs to see what people are saying about something new but not as a way to learn about it in the first place.
- Articles: positive reaction to articles tended to be conditioned by context and circumstances (e.g., what is the nature of the article, what is the source/where does it appear (i.e., is it credible/reputable source), how long is it, is it easily accessible, can it be shared so as to be discussed. Credibility of articles also played a role (was it written by a credible source/journal or was it written by BuzzFeed).
Appendix
1: Methodological Notes
Qualitative and quantitative research was conducted with the target population: Canadian SMEs that export. This includedan online survey and in-depth, one-on-one telephone interviews.
The following specifications applied to the online survey:
Regarding non-response bias, this survey sample over-represented firms employing 20 or more employees and under-represented firms with fewer than 20 employees. Regionally, firms in Ontario and Quebec were over-represented in the sample and firms in the western provinces were under-represented. This sample imbalance was corrected through weighting. However, the extent to which this non-response biased survey estimates is not known.
The following specifications applied to the in-depth interviews:
All steps of the project complied with The Standards for the Conduct of Government of Canada Public Opinion Research.
2: Research Instruments
A. Online Questionnaire
Landing page
Please select the language in which you wish to complete the survey.
- English/Anglais
- French/Français
[NEXT]
Survey Introduction page
Thank you for agreeing to take part in this short survey being conducted on behalf of the Government of Canada by Phoenix Strategic Perspectives Inc. Click here if you wish to verify the authenticity of this survey. The survey should take no more than 15 minutes to complete and is voluntary and completely confidential. Please be assured that all opinions will remain anonymous and will not be attributed to you personally in any way. To view our privacy policy, click here.
Click ‘Next’ to start the survey.
[NEXT]
PROGRAMMING NOTES:
-
Click here if you wish to verify the authenticity of this survey. A new window will open if a respondent selects this. The text will read:
If you have any questions about the survey, please contact Emma Blackburn, Phoenix Strategic Perspectives Inc., at (613) 260-1700 ext. 221 (eblackburn@phoenixspi.ca).
-
To view our privacy policy, click here. A new window will open if a respondent selects this. The text will read:
Phoenix Strategic Perspectives Inc. supports and strictly adheres to the industry standards and guidelines for Internet and other types of research.
On January 1, 2004, the Canadian government enacted the Personal Information Protection and Electronic Documents Act (PIPEDA), which protects the privacy and rights of the public while recognizing and supporting legitimate market research practices. Phoenix continuously monitors its security and data management practices to ensure it is in full compliance with the Act. You can learn more about PIPEDA legislation at http://laws.justice.gc.ca/en/P-8.6/index.html. Your personal identifying information (name, e-mail address, etc.) will never be shared with any third party without your express consent. Additionally, your responses are combined with those of other people and are tabulated in the aggregate. Any answers you provide to survey questions will remain entirely confidential.
SECTION TITLES SHOULD NOT APPEAR ON SCREEN FOR RESPONDENTS.
DO NOT PRESENT QUESTION NUMBERS ON SCREEN FOR RESPONDENTS.
ALL QUESTIONS ARE MANDATORY.
UNLESS OTHERWISE STATED, ALLOW ONE RESPONSE ONLY.
Screening Questions
S1. Is your company currently engaged in any of the following activities? [TCS SURVEY]
Select all that apply
- Exporting goods to foreign market(s)
- Exporting services to foreign market(s)
- Engaged in a partnership or joint venture with a foreign company
- Licensing a product, brand or technology from a foreign company
- Licensing a product, brand or technology to a foreign organization
- Seeking international sources of project financing or venture capital
- Seeking research and development and/or technology partnership opportunities
- Importing goods or services from outside Canada
- None of the above [THANK/TERMINATE]
[THANK/TERMINATE IF ONLY: “F: Seeking international sources of project financing or venture capital”; “G: Seeking research and development and/or technology partnership opportunities”; or “H: importing”]
TERMINATION MESSAGE:
Thank you very much for your interest in completing this survey. Unfortunately you are not eligible for this survey.
S2. How many employees work for your company? Please include part-time employees as full-time equivalents.
- Under 5 [MICRO]
- 5-19 [SMALL]
- 20-49 [SMALL]
- 50-99 [SMALL]
- 100-199 [MEDIUM]
- 200-499 [MEDIUM]
- 500 and over [THANK/TERMINATE]
- Don’t know/no response [THANK/TERMINATE]
S3. Which title best describes your role within the company?
- Owner/operator
- President
- Vice President
- Director (e.g. finance, marketing)
- Operations (e.g. supervisor, manager)
- Other. Specify [TEXT]
S4. How familiar are you with your company’s international business activities?
- I am not at all familiar with my company’s international business activities [THANK/TERMINATE]
- I am aware of my company’s international business activities, but I am not directly involved
- I am directly involved in my company’s international business strategy
- I am responsible for my company’s international business strategy
- Don’t know/not sure [THANK/TERMINATE]
S5. Is your company’s headquarters in Canada?
- Yes
- No [THANK/TERMINATE]
- Don’t know/not sure [THANK/TERMINATE]
S6. In which province or territory is your company’s headquarters located?
- Newfoundland
- Nova Scotia
- Prince Edward Island
- New Brunswick
- Quebec
- Ontario
- Manitoba
- Saskatchewan
- Alberta
- British Columbia
- Northwest Territories
- Yukon
- Nunavut
- Don’t know/no response
S7. Is your company currently a client of the Trade Commissioner Service, or TCS? Note: You are a client of the Trade Commissioner Service if you (or your company) received a service or services in the last two years and a follow-up satisfaction survey about that service(s). Clients typically receive a satisfaction survey 3 months after receiving the TCS service.
- Yes [THANK/TERMINATE]
- No
- Don’t know/not sure
Section A: Company Profile
A1. In which industry or sector does your company operate? If your company is active in more than one, please identify the main sector.
- Aerospace
- Agriculture & Agri-food
- Arts & Cultural Industries
- Automotive
- Chemicals & Plastics
- Cleantech
- Consumer Products
- Defence & Security
- Education
- Financial & Insurance Services
- Forestry & Wood Products
- Government
- Industrial Machinery
- Information & Communications Technology
- Infrastructure/Building Products & Services
- Life Sciences
- Mining
- Ocean Technologies
- Oil & Gas
- Professional Services
- Tourism
- Transportation
- Other. Specify [TEXT]
A2.In your last fiscal year, what were your company’s total revenues?
- Less than $250,000
- $250,000 to less than $500,000
- $500,000 to less than $1 million
- $1 million to less than $5 million
- $5 million to less than $10 million
- $10 million to less than $25 million
- $25 million to less than $50 million
- $50 million to less than $100 million
- $100 million or more
- Don’t know/no response
A3. For how many years has your company been exporting goods or services internationally?
- Less than two years
- Between two and five years
- Between 6 and 10 years
- More than 10 years
- Don't know/Not sure
Section B: Exporting Profile
We’d like to know a bit about your international business activities and strategy.
B1. Does your organization export goods and services… [TCS SURVEY]
- Only to the United States [GO TO C1]
- To the United States and other foreign markets [ASK B2 AND B3]
- To foreign markets excluding the United States [ASK B2 AND B3]
- Don’t know/not sure [GO TO C1]
B2. Which markets does your company currently export to?
Select all that apply
-
Asia and Pacific
- Afghanistan
- Australia
- Bangladesh
- Brunei Darussalam
- Cambodia
- China
- Hong Kong, SAR
- India
- Indonesia
- Japan
- Korea, Republic
- Laos
- Malaysia
- Mongolia
- Myanmar
- New Zealand
- Pakistan
- Philippines
- Singapore
- Sri Lanka
- Taiwan
- Thailand
- Vietnam
-
Central and South America
- Argentina
- Barbados
- Brazil
- Chile
- Colombia
- Costa Rica
- Cuba
- Dominican Republic
- Ecuador
- El Salvador
- Guatemala
- Guyana
- Haiti
- Jamaica
- Panama
- Paraguay
- Peru
- Trinidad and Tobago
- Uruguay
- Venezuela
-
Middle East and Africa
- Algeria
- Burkina Faso
- Cameroon
- Congo, Democratic Republic
- Côte d'Ivoire
- Egypt
- Ethiopia
- Ghana
- Israel
- Jordan
- Kenya
- Kuwait
- Lebanon
- Libya
- Mali
- Morocco
- Mozambique
- Nigeria
- Qatar
- Rwanda
- Saudi Arabia
- Senegal
- South Africa
- Sudan
- Tanzania
- Tunisia
- United Arab Emirates
- West Bank and Gaza Strip
- Zambia
- Zimbabwe
-
North America
-
Europe
- Austria
- Belgium
- Bulgaria
- Croatia
- Cyprus
- Czech Republic
- Denmark
- Estonia
- Finland
- France
- Germany
- Greece
- Hungary
- Iceland
- Ireland
- Italy
- Kazakhstan
- Latvia
- Lithuania
- Luxembourg
- Malta
- Netherlands
- Norway
- Poland
- Portugal
- Romania
- Russia
- Serbia
- Slovak Republic
- Slovenia
- Spain
- Sweden
- Switzerland
- Turkey
- Ukraine
- United Kingdom
- Other (Specify)
- Don’t know /not sure
B3.Which markets, if any, is your company thinking about, or interested in, exporting to?
Select all that apply
- Repeat list from B2
- We’re not thinking about or interested in other markets at this time
- Don’t know /not sure
Section C: Exporting Obstacles and Challenges
C1. How much assistance, if any, does your company need in the following areas when developing business in markets outside of Canada? [TCS SURVEY - MODIFIED]
[GRID; ROTATE ITEMS]
[ROWS]
- Market intelligence and information
- Referrals to legal professionals, human resource professionals, translators and other professional service providers
- Support for the protection of intellectual property rights, government procurement and/or regulatory matters
- Referrals to international business opportunities/sales leads
- Referral of technology and/or R&D partnership opportunities
- Referrals to other relevant commercial programs and services
- Information or advice on locating financial/funding assistance
- Recommendations on trade fairs/trade missions to attend
- Practical advice on timing and organizing your business trip
- Information about organizations or companies in foreign markets
- Understanding responsible business practices in foreign markets
[COLUMNS]
No assistance at all
Very little assistance
Some assistance
A great deal
Don’t know/not sure
C2. How large of an obstacle, if at all, are each of the following issues to your company’s activities in international markets? [TCS SURVEY - MODIFIED]
[GRID; ROTATE ITEMS]
[ROWS]
- The value of the Canadian dollar
- Canadian export taxes or permits
- Uncertainty of regulatory requirements in other countries
- Discriminatory or arbitrary treatment toward Canadian investors or their investments
- Lack of access to financing or funding
- Concern of violation of your patents and/or intellectual property rights
- Foreign tariffs or trade barriers
- Linguistic or cultural obstacles
- Labor availability and skills
- Corruption
- Lack of information about international business opportunities (i.e., export sales leads)
- Lack of market contacts such as potential buyers and partners, technology sources, agents, etc.
- Other obstacles or challenges (specify nature of obstacle or challenge)
[COLUMNS]
No obstacle at all
Minor obstacle
Moderate obstacle
Major obstacle
Don’t know/not applicable
Section D – Awareness of Free Trade Agreements
Free trade agreements are negotiated to reduce trade barriers, such as import quotas and tariffs, and to increase the trade of goods and services among the participating countries.
D1. How familiar are you with the following free-trade agreements?
[GRID; ROTATE ITEMS]
[ROWS]
- Canada-European Union Comprehensive Economic and Trade Agreement (CETA)
- Canada-Korea Free Trade Agreement (CKFTA)
- Canada-Israel Free Trade Agreement (CIFTA)
- Modernized Canada-Chile Free Trade Agreement (CCFTA)
- Canada-Ukraine Free Trade Agreement (CUFTA)
- Comprehensive and Progressive Trans-Pacific Partnership (CPTPP)
[COLUMNS]
- Never heard about it
- Heard about it, but do not know the details
- Heard about it, and know some details
- Heard about it, and I’m aware of the details
[IF D1=NEVER FOR ALL FTAS GO TO PREAMBLE TO D3]
D2. Does your company currently use or plan to use in the next year any of the following free trade agreements? Keep in mind that there are many ways to use a free trade agreement. For example, as a company, you may be using a free trade agreement if your company has:
- claimed preferential tariff treatment for a product your company exports, benefiting from the reduction or elimination of a tariff;
- claimed preferential tariff treatment for an imported product, reducing the cost of your business inputs;
- taken advantage of temporary entry provisions included in an agreement that have facilitated your entry and work authorization in the other country;
- taken advantage of new or enhanced access to government procurement opportunities in a free trade agreement partner country;
- done business in a free trade agreement partner country in a services sector that has benefitted from improved market access commitments thanks to a free trade agreement; or
- invested in a country with which Canada has a free trade agreement, if the Agreement’s new investment protections influenced your decision to make the investment.
[ROWS=FTAS RESPONDENT HAS HEARD OF AT D1 EXCLUDING CPTPP]
- Canada-European Union Comprehensive Economic and Trade Agreement (CETA)
- Canada-Korea Free Trade Agreement (CKFTA)
- Canada-Israel Free Trade Agreement (CIFTA)
- Modernized Canada-Chile Free Trade Agreement (CCFTA)
- Canada-Ukraine Free Trade Agreement (CUFTA)
[COLUMNS]
Currently use
Plan to use
Don’t know/not sure
PROGRAMMING NOTE:
IF RESPONDENT IS ONLY AWARE OF ONE FTA, DO NOT USE A GRID. USE THE FOLLOWING FORMAT:
Does your company currently use or plan to use in the next year the [INSERT FTA]?
- Currently use
- Plan to use
- Don’t know/not sure
[TEXT FOR RESPONDENTS TO READ:]
The Comprehensive and Progressive Agreement for Trans-Pacific Partnership (CPTPP) is a free trade agreement between Canada and 10 other countries in the Asia-Pacific region: Australia, Brunei, Chile, Japan, Malaysia, Mexico, New Zealand, Peru, Singapore, and Vietnam. Once the agreement is fully implemented, 99% of all tariff lines will be duty-free. The CPTPP also provides exporters with enhanced access to government procurement opportunities in CPTPP markets, offers greater certainty and stability for investors and companies in the service sectors, and increases labour mobility.
On December 30, 2018 the CPTPP entered into force among the first six countries to ratify the agreement – Canada, Australia, Japan, Mexico, New Zealand, and Singapore. On January 14, 2019, the CPTPP entered into force for Vietnam. Peru, Chile, Malaysia, and Brunei have not yet ratified the Agreement.
D3. How likely is it that your company will start to trade with CPTPP countries as a result of this free trade agreement?
- Not at all likely
- Not very likely
- Somewhat likely
- Very likely
- Don’t know/not sure
- We already trade with CPTPP countries
[ASK D4 IF D3=WE ALREADY TRADE WITH CPTPP COUNTRIES]
D4. How likely is it that your company will continue to do international business with CPTPP countries as a result of this free trade agreement?
- Not at all likely
- Not very likely
- Somewhat likely
- Very likely
- Don’t know/not sure
[ASK D5 IF D3=WE ALREADY TRADE WITH CPTPP COUNTRIES]
D5. Over the next three years, do you expect your company’s volume of exports to the Asia-Pacific region will …?
- Increase significantly
- Increase somewhat
- Stay about the same
- Decrease somewhat
- Decrease significantly
- Don’t know/not sure
[ASK IF IMPORTER AT S1]
D6. Over the next three years, do you expect the volume of your company’s imports from the Asia-Pacific region will …?
- Increase significantly
- Increase somewhat
- Stay about the same
- Decrease somewhat
- Decrease significantly
- Don’t know/not sure
- We do not import from the Asia-Pacific region
[ASK EVERYONE]
D7. Which, if any, other free trade agreements does your company currently use or plan to start using in the next year?
[GRID]
[ROWS]
- Canada-Colombia Free Trade Agreement
- Canada-Costa Rica Free Trade Agreement
- Canada-European Free Trade Association Free Trade Agreement
- Canada-Honduras Free Trade Agreement
- Canada-Jordan Free Trade Agreement
- North American Free Trade Agreement (NAFTA)
- Canada-Panama Free Trade Agreement
- Canada-Peru Free Trade Agreement
- Other. Please specify: [TEXT]
[COLUMNS]
Currently use
Plan to use
Do not plan to use
Don’t know/not sure
D8. Have you heard anything about the following free trade agreement negotiations or discussions?
[GRID]
[ROWS]
- Canada-MERCOSUR free trade agreement negotiations
- Canada-Pacific Alliance free trade negotiations
- Canada-ASEAN exploratory discussions
[COLUMNS]
- Never heard about it
- Heard about it, but do not know the details
- Heard about it, and know some details
- Heard about it, and I’m aware of the details
Section E – Use and Impact of FTAs
[ASK E1 IF DO NOT USE FTAS BASED ON D2 D3, D7]
E1. Why is your company not using free trade agreements to export goods or services?
Select all that apply
[ROTATE ITEMS]
- Did not know the free trade agreements exist
- Lack of information on free trade agreements
- Difficult to determine how to take advantage of free trade agreements
- Complex eligibility requirements (i.e., rules of origin)
- Reduction in tariffs is not worth the administrative cost of claiming the tariff preference
- Could not meet the rules of origin
- Not interested in the markets accessible through free trade agreements
- Don’t see any benefit
- Use another trade arrangement
- Use alternative duty relief measures
- Barriers resulting from differences in legal systems
- Barriers resulting from linguistic and/or cultural differences
- Lack of financing options to facilitate cross border trade
- Other. Specify [TEXT]
[NON-FTA USERS GO TO G1]
[ASK E2 IF USE FTAS BASED ON D2 D3, D7]
E2. Thinking about the free trade agreements that your company currently uses, has your company benefited from any of the following?
Select all that apply
[ROTATE ITEMS]
- Better conditions for exporting your services
- Tariff reduction/elimination on goods
- Easier access to government procurement opportunities
- Labour mobility clauses/temporary entry
- Greater business certainty/stability due to investment clauses in the agreement
- Other. Specify [TEXT]
[ASK IF E2=TARIFF REDUCTION/ELIMINATION ON GOODS]
E3. Did your company, your manufacturer or the importer of your goods claim reduced customs duties under a free trade agreement?
[GRID]
[ROWS]
- Your company
- Your manufacturer
- The importer of your goods
[COLUMNS]
Yes
No
Don’t know/not sure
Not applicable
[ASK IF E3=NO]
E4. There are a number of reasons why a company might not claim reduced customs duties under a free trade agreement. What impact, if any, did the following factors have on your company’s decision to not claim reduced customs duties for your goods?
[GRID; ROTATE ITEMS]
[ROWS]
- The good we export is not covered by the free trade agreement.
- We did not see a significant tariff reduction as a result of the free trade agreement.
- We did not know we needed to apply for a free trade agreement preference.
- We do not understand free trade agreements or the eligibility requirements/rules of origin.
- The delays associated with obtaining Origin Declarations are too long.
- The administrative costs associated with obtaining Origin Declarations are too high.
- We use the tariff preferences available under the World Trade Organization (WTO) because the rules/requirements are simpler.
[COLUMNS]
No impact at all
A small impact
A moderate impact
A big impact
Don’t know/not sure
[ASK IF E2= EASIER ACCESS TO GOVERNMENT PROCUREMENT OPPORTUNITIES]
E5. How much do you agree or disagree with the following statements? As a result of free trade agreements…
[GRID; ROTATE ITEMS]
[ROWS]
- Our company has better access to information regarding foreign government procurement opportunities.
- Our company is pursuing foreign government procurement contracts in free trade agreement partner countries.
- Our company has been able to more easily apply for foreign government procurement opportunities.
- The foreign government procurement process fairly lets Canadian companies compete against local businesses.
[COLUMNS]
Strongly disagree
Disagree
Neutral
Agree
Strongly agree
Don’t know/not sure
[ASK IF E2=LABOUR MOBILITY CLAUSES/TEMPORARY ENTRY]
E6. How much do you agree or disagree with the following statements? As a result of free trade agreements…
[GRID; ROTATE ITEMS]
[ROWS]
- Our company has increased the number of business trips taken to free trade agreement markets.
- Our company has sent staff to free trade agreement markets.
- Our company’s management and personnel have more capacity to work in free trade agreement markets.
- Our company’s management and personnel have more capacity to access opportunities as contractors in free trade agreement markets.
[COLUMNS]
Strongly disagree
Disagree
Neutral
Agree
Strongly agree
Don’t know/not sure
[ASK ALL WHO HAVE USED FTAs]
E7. How much do you agree or disagree with the following statements? As a result of free trade agreements…
[GRID; ROTATE ITEMS]
[ROWS]
- Our company has changed administrative practices to build in free trade agreement-related processes, such as Origin certification.
- Our company has improved supply chain arrangements or integration.
- Our company has improved contractual arrangements with buyers (e.g., Incoterms or other terms of trade)
[COLUMNS]
Strongly disagree
Disagree
Neutral
Agree
Strongly agree
Don’t know/not sure
E8. How much, if at all, do free trade agreements influence your company’s export strategy and encourage you to consider new markets?
- Not at all
- A small amount
- A moderate amount
- A great deal
- Don’t know/not sure
[DO NOT ASK IF E8=NOT AT ALL]
E9. How much, if at all, have free trade agreements influenced your company’s decision to…?
[GRID; ROTATE ITEMS]
[ROWS]
- …establish abroad.
- …sell a wider range of goods or services.
- …conduct a broader range of business activities in a country covered by a free trade agreement.
- …engage in offshoring or outsourcing.
- …bid for government procurement contracts in free trade agreement markets.
- …invest in a country covered by a free trade agreement.
[COLUMNS]
Not at all
A small amount
A moderate amount
A great deal
Don’t know/not sure
Does not apply
[ASK ALL WHO HAVE USED FTAs]
E10. What other benefits, if any, has your company experienced as a result of using free trade agreements?
Select all that apply
[ROTATE ITEMS]
- Increase in sales/revenues
- Products are more price competitive in our export market(s)
- Company has been able to sell to new customers in free trade agreement markets
- Company has increased sales to existing customers
- Access to specialized goods and materials outside of Canada
- Access to specialized expertise/services outside of Canada
- Other. Specify [TEXT]
- Our company has not experienced any benefits
Section F – Awareness of TCS
F1. Are you aware that the Government of Canada has information and resources available to help companies expand their business abroad?
F2. Have you ever heard of the Trade Commissioner Service, or TCS?
F3. What, if anything, have you heard about the Trade Commissioner Service, or TCS?
[OPEN TEXT BOX]
- I’ve heard of the TCS, but I can’t recall anything specific
F4. How did you initially learn about the Trade Commissioner Service (or TCS)? [TCS SURVEY]
- Referral from Export Development Canada (EDC)
- Referral from the Business Development Bank of Canada (BDC)
- Referral from the Canadian Commercial Corporation (CCC)
- Referral from a federal government body
- Referral from a provincial government body
- Referral from another organization
- Internet
- Third party event
- TCS event in Canada (please provide details)
- TCS event abroad (please provide details)
- Other (please specify)
- Don't know
Section G – Related Issues
G1. Where do you get your information and advice on doing business abroad (i.e., exporting and/or using free trade agreements)?
Select all that apply
-
Trade promotion organisations websites and free online tools (webinars, podcast)
- Trade Commissioner Service
- Provincial export organization
- EDC
- BDC
- Others
- Private Training courses
- Shipping companies (e.g. FedEx, Purolator, UPS, etc.)
- Customs broker/freight forwarder
- Industry/business associations
- Business trade publications ( digital or print)
- Financial institutions
- Professional services (lawyers, accountants, consulting firms, etc.)
- Business associate/colleague/partner
- Retailer
- Brokers (e.g., customs, trade, etc.)
- Professional Advisors
- Other. Please specify: [TEXT]
G2. When it comes to staying on top of industry trends and general business information, where do you typically look?
Select all that apply
-
Social media
- LinkedIn
- Twitter
- Facebook
- Other. Please specify: [TEXT]
-
News media
- Online
- Print publications (e.g. newspaper)
- Television
- Radio
G3. How do you prefer to consume information when learning or researching something new?
Select all that apply
- I prefer to read whitepapers
- I prefer to attend webinars
- I prefer to attend in-person training
- I prefer to get answers to my specific questions from an expert (via phone, forum, chat or email)
- I prefer to have step-by-step guides
- I prefer to watch short videos
- I prefer to read blogs
- I prefer to read articles
- Other (please specify): [OPEN END]
G4. Which of the following best describes how you prefer to read information?
- I prefer to look at the charts / tables / infographics to understand the main points
- I prefer to have the information summarized in an executive summary
- I prefer to skim the information to get the main points
- I prefer to read everything
G5. On which device would you do each of the following activities? You can choose more than one device for each activity.
[Multiple mention Grid]
[ROWS]
- Read emails
- Answer emails
- Read an article
- Look at an infographic
- Attend a webinar
- Visit a website
- Manage your calendar
- Participate in a chat session
- Keep up to date with social media
- Apply for financial support
[COLUMNS]
Laptop / Notebook
Desktop
Tablet
Smartphone
I wouldn’t do this activity digitally
I don’t do this activity
G6. Please choose the option that best describes how you would research something new.
- I would call someone first to help me figure out where to look for new information and then I would search for it in a specific place online. I would probably want to have someone to talk to after I found the information just to make sure I have the right information
- I would start searching online for the information I am looking for, sifting through all of the available sources and then making a decision about what my next step is based on everything I learned.
- I would only look at information if it came through my inbox first. I would only go online to search something if the email or subscription caught my attention.
- I would ask someone in my company to research the information for me and present me with their findings
These last few questions about your company will help us classify the data.
G7. Do any of the following apply to your company?
Select all that apply
- My company is at least 51% owned, managed, or controlled by one or more women.
- My company is majority-owned by Indigenous peoples. This definition includes bands, partnerships or ventures with non-Indigenous companies, given that Indigenous peoples own at least 51%.
- My company is owned, controlled, or managed by a person aged between 18-39-year-old.
- None of the above
G8. Does your company have operations in other provinces or territories outside of where it’s headquartered?
- Yes
- No [SKIP G9]
- Don’t know/no response [SKIP G9]
G9. In which provinces or territories does your company have operations?
- Newfoundland
- Nova Scotia
- Prince Edward Island
- New Brunswick
- Quebec
- Ontario
- Manitoba
- Saskatchewan
- Alberta
- British Columbia
- Northwest Territories
- Yukon
- Nunavut
- Don’t know/no response
G13. Would you be willing to participate in a follow-up discussion on these same topics to explore a few areas in greater depth? If you are willing, you may be contacted in the next few weeks for a follow-up phone interview by a senior researcher from Phoenix Strategic Perspectives. Participants who qualify and complete the phone interview will receive $150 to thank them for their time. If you are willing to participate, you will be asked to disclose your contact information to Phoenix Strategic Perspectives. Would you be willing to participate?
By filling in the information below, you consent to the disclosure of this information to Phoenix Strategic Perspectives for the limited purpose of participating in a follow-up phone interview.
Name:
Telephone Number:
Email:
I do not wish to provide contact details [THANK/TERMINATE]
Completion Page
That concludes the survey. The results will be available at the Library and Archives Canada website in the coming months. Thank you very much for your thoughtful feedback. It is much appreciated.
B. Interview Guide
Initial Contact: Scheduling
NOTE: Potential participants will be recruited from the online survey. The list of survey respondents who agree to participate will be provided and it will include the individual’s name, telephone number and email address. The first contact from Phoenix SPI will be via email; subsequent contact will be via telephone. Those contacted to participate in an interview will be offered the option to conduct the interview in their official language of choice.
- Remind individual of agreement to be contacted for a follow-up telephone interview.
- Explain purpose of interview: Global Affairs Canada has commissioned Phoenix SPI to conduct the survey you participated in and these interviews to inform the department’s efforts to help Canadian companies diversify exports abroad. The findings from this research will enable Global Affairs Canada to develop information and programming to support companies like yours.
- Confirm agreement to take part.
- Interview would take approximately 45 minutes.
-
Confirm anonymity and confidentiality:
- interview conducted on first name basis only; and
- resulting reports will not identify the participant in any way.
- Mention intent to record the interview.
- Schedule time for interview, if agreeable.
- Offer to conduct the interview either in English or in French.
Interview
NOTE BASED ON SURVEY:
- Aware of Trade Commissioner Service
- Not aware
I. Introduction
- Introduce yourself, thank the individual for agreeing to participate, and re-iterate expected length of interview.
- Remind him/her that responses are confidential: Your responses during the interview will be kept confidential and will not influence any future interactions you may have with Global Affairs Canada. The feedback you provide will be used for research purposes only and will not be attributed to you personally or your company in the report resulting from this study.
- Request to record interview at this point: With your permission, I’d like to record the interview. The recording is to accurately document the information you provide and will be used to write the report only. It will not be shared with any third party, but it may be shared with the Global Affairs Canada team working on this project. Do I have your permission to record this interview?
II. Context: Corporate Profile
I’d like to begin by asking you a few questions about you and your company’s involvement in international business.
- To begin, what is your job title? And, briefly, what are your main responsibilities at your company? [KEEP BRIEF]
-
What’s the nature of your company’s international business activities at this time? That is, what types of activities does your company engage in as part of its international business?
Prompts if needed:
- Exporting goods only
- Exporting services only
- Exporting a mix of both goods and services
- Designing products in Canada, but manufacturing/selling them from foreign countries
- Having direct investments abroad
- Sourcing and importing components as part of a supply/value chain
-
In what countries or regions of the world is your company active with respect to your international business activities? Do you undertake certain types of activities in one country or region but not in another? If so, please explain.
Probe: - Link between types of activities (e.g. direct investment, exporting) and regions
- How long has your company been involved in international business?
- Did your company start out with an international focus or did it begin by participating only in the domestic market in Canada and then later develop an international focus? Why is that? What motivated or encouraged your company to become involved in international business in the first place?
-
There are different reasons why companies might become engaged in international business. What’s the main reason your company is active in international business? Any other reasons? Have these reasons changed over time? If so, in what way?
Prompts if needed:
- Canadian economic conditions (strong or weak)
- Global economic conditions (strong or weak)
- To increase sales/profits
- To grow/expand in new or existing markets
- To diversify
- Canadian market too small/saturated
- Approached by foreign investor/buyer
- Excitement/appeal of serving foreign markets
- Links with other countries (e.g. emigrated from, family in)
- Niche product/designed for specific market(s)
- And, how would you characterize your company’s approach toward its international business activities? WAIT FOR TOP-OF-MIND RESPONSE, THEN PROMPT: Would you say pursuing activities in international markets is part of your company’s corporate or business strategy or is it something your company does on more of an ad hoc basis—that is, when the opportunity arises?
III. Challenges related to international business activities
I’d now like to focus on the challenges facing companies in terms of their international business activities.
- When you completed the survey, you mentioned that the main challenges or obstacles your company faces in relation to its current activities in international markets are [INSERT]? Can you please tell me a bit more about these issues, in particular, how and why they present a challenge for your company?
-
Now, thinking specifically about international trade diversification, what are the most important issues or challenges that affect your company’s ability to diversify and enter new markets? WAIT FOR TOP-OF-MIND RESPONSE, THEN PROMPT: Are these the same challenges you just talked about that affect your company’s current activities in international markets?
INTERVIEWER NOTE: If asked what is meant by “trade diversification”, explain that this refers to engaging in or entering new markets, markets that are different from those typically entered by companies.
- What type of support or assistance, would be most valuable or useful to your company to help address these challenges? Anything else? PROBE HOW THIS WILL HELP THE COMPANY AND WHAT THE ASSISTANCE/SUPPORT SHOULD/COULD LOOK LIKE IN CONCRETE TERMS.
Prompts if needed:
- Financial assistance/capital
- Insurance
- Strategic information (probe for type; e.g. new/growing markets, potential obstacles)
- Business leads
- Help promoting products/services
- Advice to help with international rules, regulations, policies
- Foreign contacts to help implement market plan
IV. International free trade agreements
Changing topics, I’d like to focus on free trade agreements.
- Canada is involved in a number of international free trade agreements. Are you aware of any of these free trade agreements? If so, which ones? What do you know about this/these free trade agreement(s)? IF PARTICIPANT CAN’T IDENTIFY ANY FTAS, SAY: Ok, in general, then, what do you know about free trade agreements?
[ROTATE BENEFITS/CHALLENGES]
- In your view, what are the benefits, if any, of free trade agreements to a company like yours?
- And, what are the challenges, if any, associated with free trade agreements for a company like yours?
[CONTINUE IF AWARE OF FTAs; GO TO SECTION V IF NOT AWARE OF ANY FTAs]
- Is your company currently using or thinking about using one of Canada’s free trade agreements? If so, which ones? In what way(s)? PROBE SPECIFIC INVOLVEMENT/USE OF EACH FTA BEING USED.
INTERVIEWER – FOR REFERENCE, CANADA’S ACTIVE FTAS:
- Comprehensive and Progressive Agreement for Trans-Pacific Partnership (CPTPP)
- Canada-Chile Free Trade Agreement
- Canada-Colombia Free Trade Agreement
- Canada-Costa Rica Free Trade Agreement
- Canada-European Free Trade Association Free Trade Agreement
- Canada-Honduras Free Trade Agreement
- Canada-Jordan Free Trade Agreement
- North American Free Trade Agreement (NAFTA)
- Canada-Panama Free Trade Agreement
- Canada-Peru Free Trade Agreement
[FOR EACH FTA IN WHICH THE COMPANY IS INVOLVED ASK]
- What challenges, if any, has your company faced in relation to the [ADD NAME OF FTA]. How would you rate the importance or significance of this/these challenges? PROBE FOR CHARACTERIZATION OF CHALLENGE AS MAJOR, MODERATE, OR MINOR.
-
Has your company sought or looked for assistance to deal with this/these challenge(s)?
- If so, where? IF GOVERNMENT IS MENTIONED, PROBE FOR SPECIFICS: LEVEL (PROV/FED), DEPARTMENT/MINISTRY, ETC. IF THE INTERNET IS MENTIONED, PROBE FOR SPECIFICS: SITE NAME, SOURCE, ETC. To what extent did [ASSISTANCE] meet your needs? PROBE SHORTCOMINGS, GAPS.
- If not, why not?
- ADJUST LANGUAGE BASED ON WHETHER OR NOT Global Affairs Canada (GAC) or the Trade Commissioner Service (TCS) HAS BEEN MENTIONED ABOVE What [more] could [the Government of Canada/Global Affairs Canada or the Trade Commissioner Service] do to assist you in addressing any of these specific challenges? PROBE BY CHALLENGE.
[IF PLANNING TO USE ANY FTAs]
- Do you anticipate any challenges related to starting to use [ADD NAME OF FTA IF ONLY ONE: “the XXXX”; IF MULTIPLE, SAY: “these free trade agreements”]. If so what challenges? And, what, if anything, could [the Government of Canada/Global Affairs Canada or the Trade Commissioner Service] do to help your company address these challenges?
[IF NOT PLANNING TO USE ANY FTAs]
- Why is your company not using or not thinking about using any of Canada’s free trade agreements?
V. TCS [ASK ONLY THOSE NOT AWARE]
- When you hear the name, Trade Commissioner Service, what’s the first words or images that come to mind? Why is that?
- And what services would you expect to be able to access through an organization called the Canadian Trade Commissioner Service? Why is that?
VI. Information Needs
Changing topics again,
-
[ONLY ASK IF INFORMATION IS NOT MENTIONED AT Q10 OR ANY POINT IN THE INTERVIEW] What are your company’s main information needs in terms of pursuing your international business activities?
Probe
- Strategic information/advice to help enter foreign markets
- Business leads
- Information about international rules, regulations, policies
- Foreign contacts to help implement market plan
-
What constraints or problems do you encounter, if any, in obtaining the information you need to support your international business activities?
Prompts if needed
- Lack of time
- Costs
- Lack of expertise/qualified staff
- Don’t know where to look
- Do you use different sources for different types of information, or do you tend to get all your information from the same source(s)? Please explain.
- How would you characterize your level of expertise when it comes to finding information and resources to assist your company with its international business activities?
-
When searching for information relevant to your company’s international business activities, what characteristics or features do you typically look for or prefer in a good information resource? That is, what makes a resource useful or valuable to you? Why is that?
Probe:
-
design / layout
- charts / tables / infographics to understand the main points
- text length
- information summarized in an executive summary
- formats (e.g., printable PDF, mobile-friendly, web/HTML, sharable)
-
How do you prefer to consume information when learning or researching something new? WAIT FOR TOP-OF-MIND RESPONSES AND THEN PROMPT WITH PROBES. Why is that? PROBE THE BENEFITS OF THE PREFERRED METHOD.
Prompts if needed
- whitepapers
- webinars
- in-person training
- experts
- step-by-step guides
- watch short videos
- read blogs
- read articles
- And, what about….INSERT METHODS NOT MENTIONED AT Q26…Would you use this to acquire information for your company? Why is that?
VI. Conclusion
- Do you have any final comments about anything we have discussed?
Thank you very much for taking the time to speak with me today. Your feedback will be very helpful.
3: Tabulated Data
[Available under separate cover]
[1] Responses to this question were regrouped for reporting purposes. Details of this can be found in the Appendix-1: Methodological Details.
[2] A small number respondents represented firms with 500 or more employees. Due to sample limitations, this was necessary in order to reach the target sample size. For weighting purposes, these companies have been grouped with medium-sized companies.
[3] Exercise caution interpreting these results due to sample sizes.
[4] Exercise caution interpreting the findings for this subgroup of respondents due to the small sample size.
[5] Exercise caution interpreting the findings for this subgroup of respondents due to the small sample size.
[6] Respondents who self-identified as clients of the TCS were not eligible to complete the survey.
[7] It is understood that some of these actions and/or activities may already have been undertaken, or are being considered, by GAC/the Government of Canada or related agencies/departments.
[8] Some examples of information could be included in different categories (e.g., ‘strategic information’ and ‘business leads’).